KPIs that match your business
Headline numbers defined your way, each with a trend line and a comparison against last month, last year or target.
Custom dashboards for Excel-driven teams
We design custom dashboards around your own KPIs, table columns, charts and pivot cuts. Upload your Excel file and the whole report refreshes in seconds, fully offline, with your data never leaving your computer.
 Jitendra RaoFounder, Excel Keys · 11+ years in MIS and analytics
What you get
Need a custom dashboard that follows the way your team already reports? You decide the KPIs, table columns, charts and pivot cuts. We design and build it, and you get everything below in one file.
Headline numbers defined your way, each with a trend line and a comparison against last month, last year or target.
The dashboard reads the columns you already have. If a file arrives with different names, map them in a few clicks.
Bars, lines, doughnuts, funnels and gauges. Click any bar or slice and every other number on the page follows.
The cuts your management asks for every month are already built, with subtotals, growth arrows and data bars.
Region, product, team, month, financial year: slicers are created from your own data and apply everywhere at once.
Create calculated fields and custom metrics without writing a formula in a cell, then use them in charts and pivots.
Send exactly what you see to a styled PowerPoint, a PDF report or Excel, with the current filters applied.
No server and no cloud upload. The dashboard runs in your browser and your data never leaves your computer.
Our work
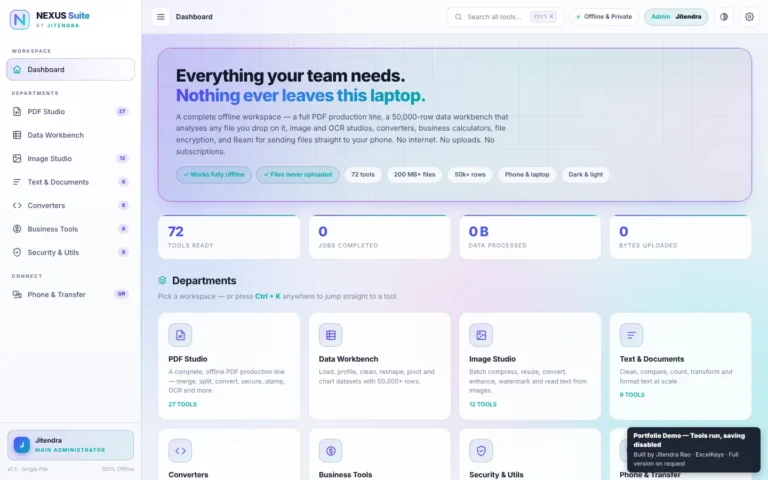
Real dashboards, shown with fictional sample data. Most of them have a live demo you can open in your browser and try yourself.
HR & Talent Acquisition
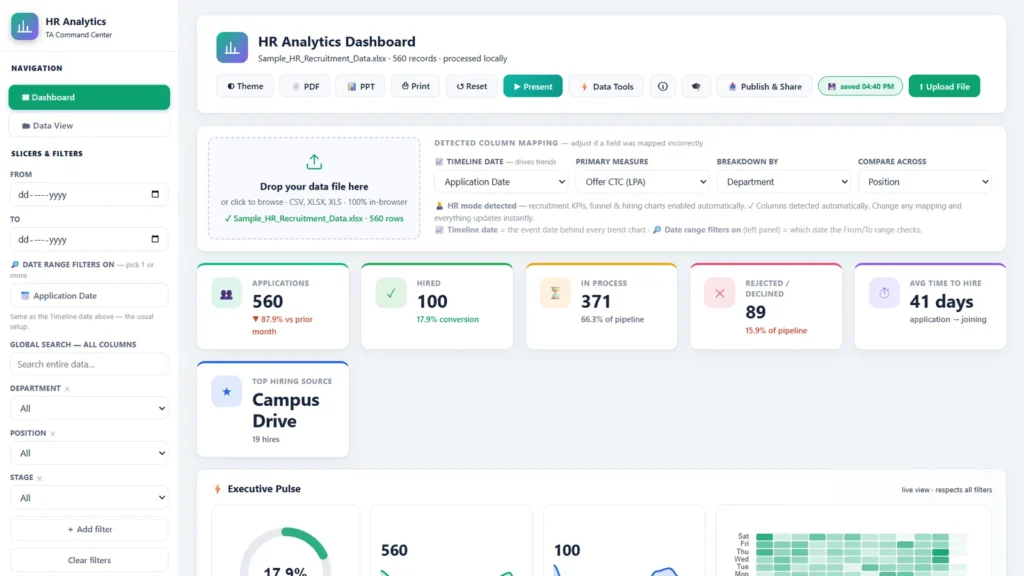
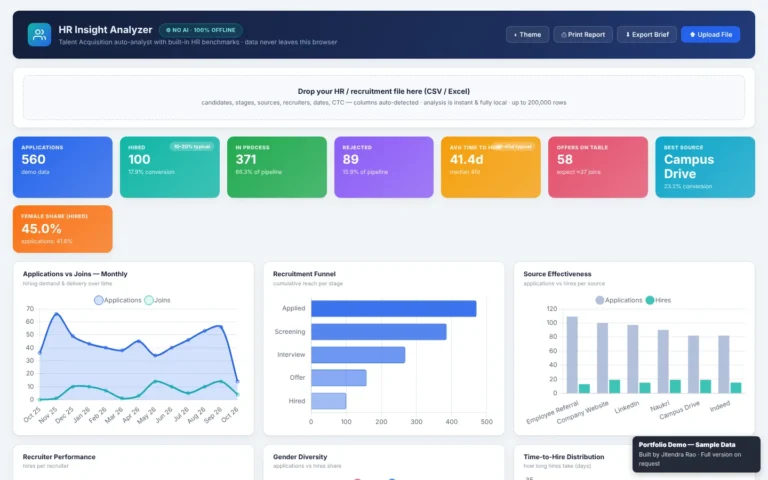
A hiring command centre: upload the recruitment tracker and get applications, hires, funnel conversion, time to hire and recruiter performance in one view.
Banking & Sales Teams
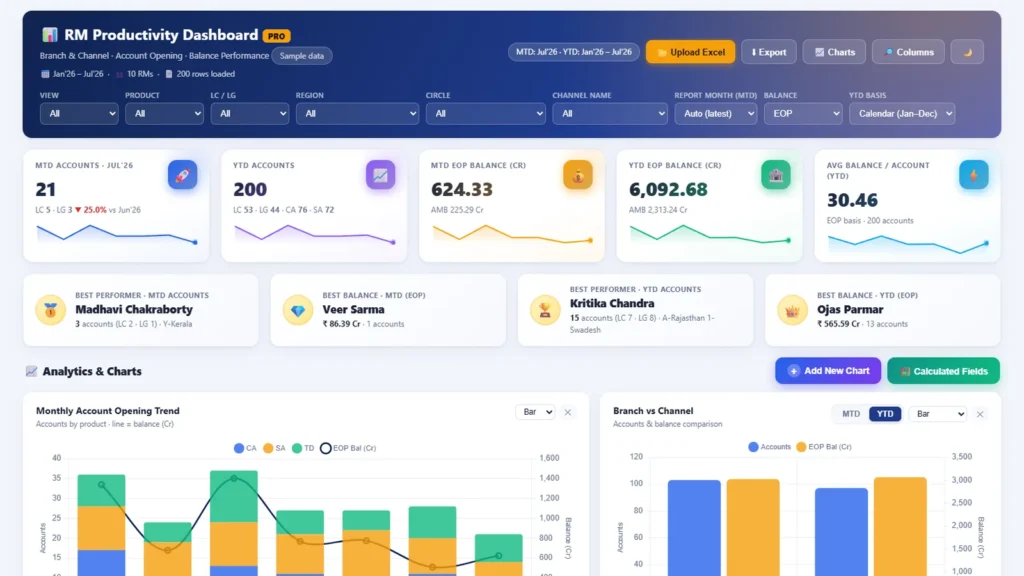
Account opening and balance performance for every relationship manager, with best-performer cards, a pivot table and a ranked leaderboard.
Sales & Business Performance
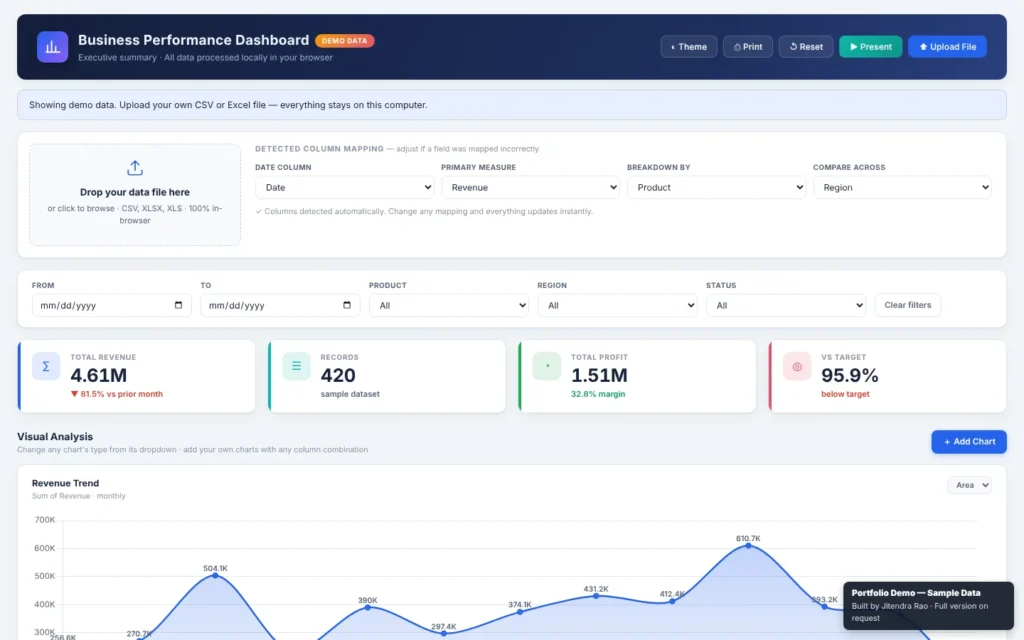
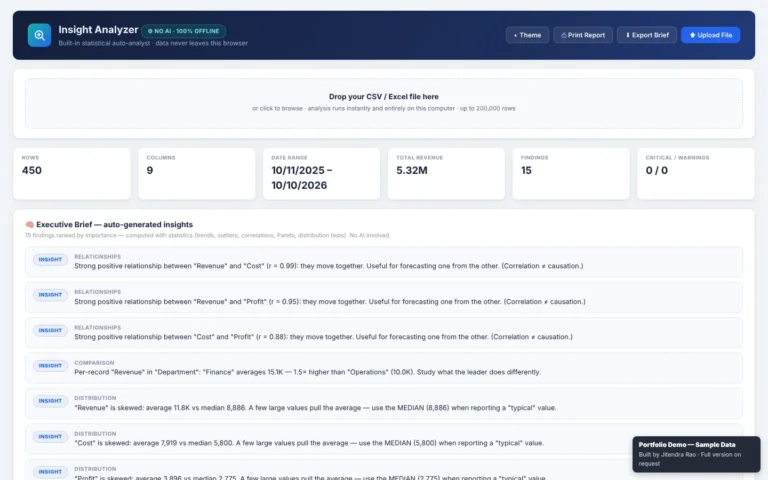
Revenue, profit and target tracking in one upload: automatic KPI cards, charts you can restyle in a click and a presentation mode for leadership reviews.
Why it matters
How it works
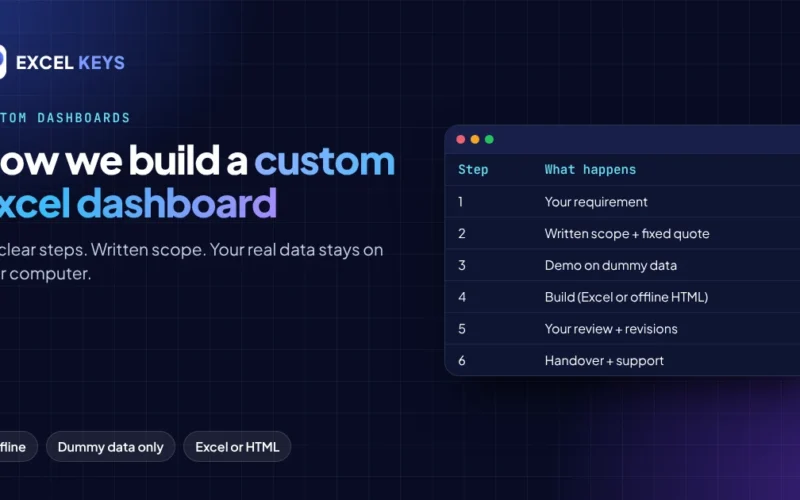
Send us your current report or a sample file with dummy data, and tell us which numbers your team looks at.
You get a clear list of KPIs, table columns, charts, pivot cuts and filters to approve before anything is built.
You test the dashboard with your own file and tell us what to adjust until it reads the way you want.
You receive the final dashboard with a short walkthrough, and we stay available when your report changes.
We know how confidential office data is. That is why every dashboard we build runs fully offline: no server, no cloud upload and no internet connection needed. The file you load stays exactly where it is.
 11+years in MIS and analytics
Who builds your dashboard
Excel Keys is led by Jitendra Rao, who brings 11+ years of hands-on experience in MIS reporting, sales analytics and dashboard automation. Every dashboard on this website grew out of a real reporting problem.
My focus is simple: make data easy to understand and reporting effortless.
Who it is for
These are the reports teams ask us about most often. Yours does not need to be on the list.
Hiring funnel, time to hire, source and recruiter performance.
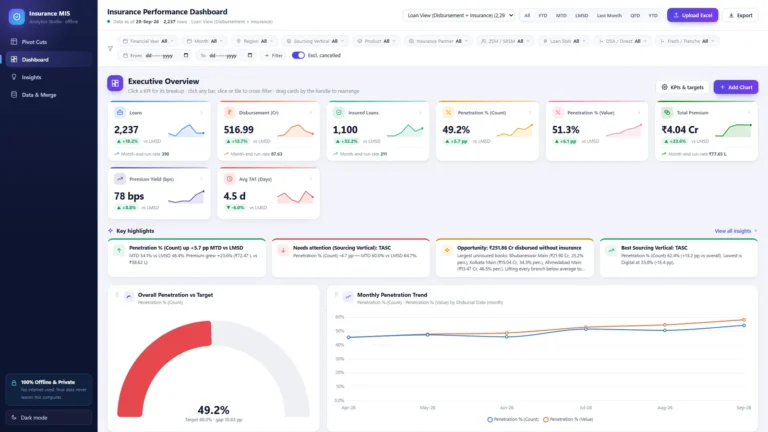
Penetration, premium, yield and partner-wise performance.
Account opening, balances, RM productivity and branch ranking.
Targets against achievement, region and product mix, top performers.
Collections, ageing, budget against actual and cost tracking.
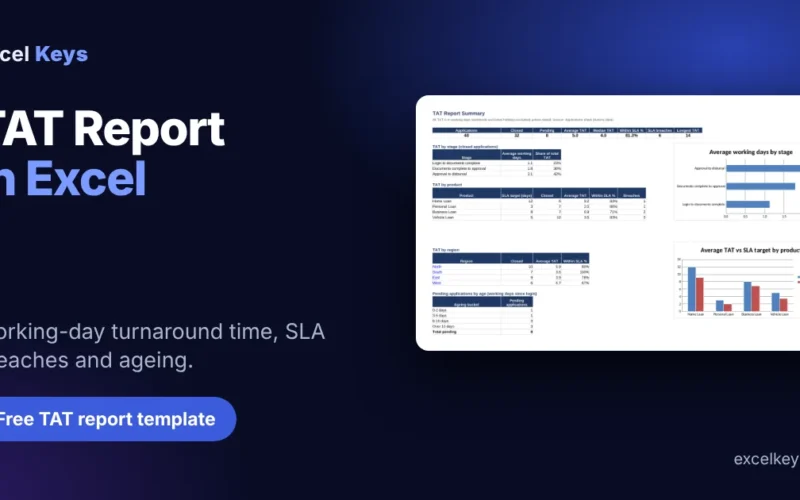
Turnaround time, stock movement, productivity and service levels.
Questions
A custom dashboard is a report built around one team's own data and questions. Instead of a fixed template, it shows the KPIs, table columns, charts and pivot cuts that team already uses, and it refreshes automatically when a new Excel or CSV file is loaded.
We build custom dashboards for teams that report from Excel. You tell us which KPIs, table columns, charts and pivot cuts you need, and we deliver a dashboard designed around exactly that. You upload your Excel or CSV file and the whole report refreshes in seconds.
Your data stays on your computer. Our dashboards run fully offline inside your browser: there is no server, no cloud upload and no internet connection needed. Nothing leaves your laptop, which is why they are a good fit for confidential office data.
No. The dashboard is delivered as a single file that opens in a normal web browser such as Chrome or Edge. There is nothing to install, no macros to enable and no monthly licence to pay for.
Yes. The dashboard detects your sheet, header row and columns automatically, and a column-mapping screen lets you point each field to the right column whenever your file layout changes.
Yes. You can add charts, create calculated fields with your own formula, build new pivot cuts, hide what you do not need and rearrange the layout, all without writing code.
Yes. Every dashboard can export what you see, with the current filters applied, to a styled PowerPoint, a PDF report, Excel or CSV, or print it directly.
Either. An Excel dashboard suits teams that already work inside Excel every day. An HTML dashboard opens in any browser, needs no software and is easy to share. We recommend one after seeing your report, and you decide before the build starts.
The price depends on the scope: the number of KPIs, the data sources and how complex the logic is. Share your requirement and you receive a clear, fixed quote before any work begins. There is no charge for the first discussion.
Send us a message on Telegram, Instagram, LinkedIn or email with a short description of your report, ideally with a sample file that uses dummy data. We reply with a plan, a timeline and a quote. Delivery time depends on the scope and is agreed before work starts.
You work directly with Jitendra Rao
Let us build yours
Tell us the KPIs, table columns, charts and pivot cuts you need. We will design a dashboard around your requirement and send you a clear plan and quote. Connect with us on the channel you prefer.