Finance & Credit Control
Collections Desk: Receivables Dashboard
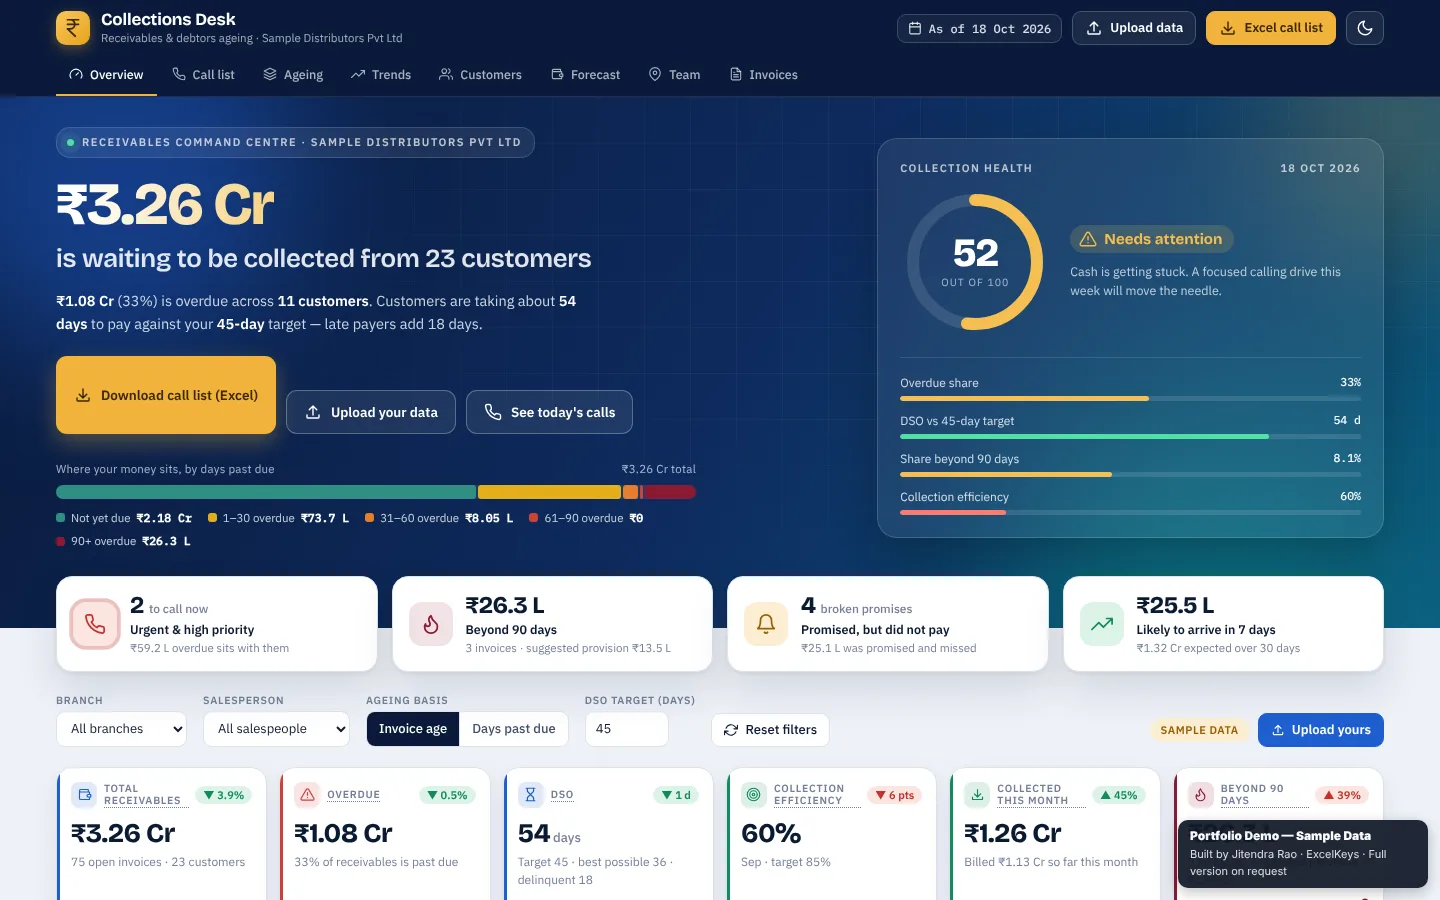
A receivables command centre: upload an invoice list and get debtors ageing, a 0 to 100 collection health score, a ranked call list and a 7 and 30 day cash forecast.
The reporting problem
Most finance teams chase every customer the same way. The ageing report is ready, but nobody acts on it, the call sheet is rebuilt every morning and the cash forecast is a guess.
What we built
A receivables command centre in eight views, from Overview to Invoices. Upload an invoice or receivables list (.xlsx, .csv or .tsv) and the health score, ageing, call list and forecast build themselves. Filter by branch, salesperson and ageing basis, and set your own DSO target.
Highlights
- A collection health score from 0 to 100, built from overdue share, DSO against your target, the share beyond 90 days and collection efficiency.
- Who to call today, ordered by urgency, with notes on broken promises and the amount at stake.
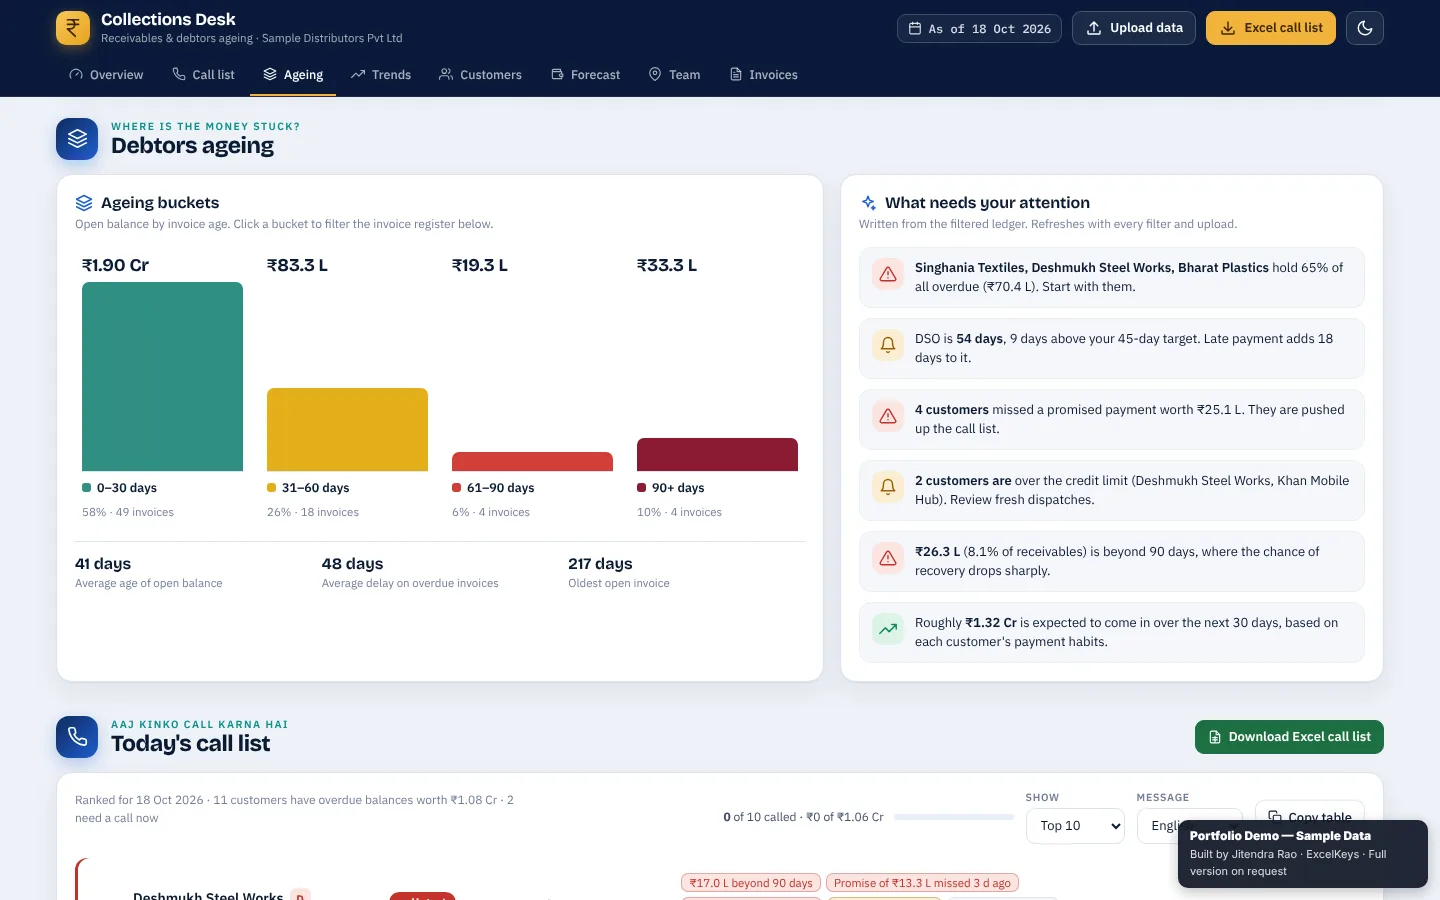
- Debtors ageing in clickable buckets with average age, average delay and the oldest invoice.
- Expected cash for the next 7 and 30 days, based on how each customer has paid before.
- Plain-language notes on who holds the overdue and where to start.
Private by design
Receivables data is read inside your browser and is never sent to a server. The public demo runs on fictional sample data. You can filter, click through every view and even load your own file, while export, print and save are switched off in the demo. The full working version is built for your team on request.
Collections Desk: Receivables Dashboard at a glance
- Built for
- Finance teams, credit control, sales heads and distributors
- Replaces
- An ageing report nobody acts on and a call sheet rebuilt every morning
- Input
- Your invoice or receivables list as .xlsx, .csv or .tsv
- Output
- Health score, debtors ageing, ranked call list and a 7 and 30 day cash forecast
- Runs
- In the browser, your file is never uploaded
Who it is for
- Credit controllers who decide every morning which customers to call
- Finance managers who report overdue and DSO to the owner
- Sales heads who need to see which salesperson or branch holds the overdue
- Distributors and business owners who sell on credit
What it measures
| Metric | What it tells you |
|---|---|
| Total receivables | Everything customers owe you today |
| Overdue share | The part of receivables already past its due date |
| DSO against target | How many days of sales are tied up in receivables, compared with your own target |
| Share beyond 90 days | The oldest, hardest-to-collect part of the book |
| Collection efficiency | How much of what fell due was actually collected |
| Collection health score | One 0 to 100 score built from the four measures above |
| Expected cash, 7 and 30 days | What is likely to arrive soon, based on each customer's payment habits |
| Credit-limit breaches | Customers whose exposure is above the limit you set |
How it works
- Upload the listDrop in your invoice or receivables list (.xlsx, .csv or .tsv).
- Review the pictureThe health score, ageing buckets and call list build themselves.
- FilterNarrow down by branch, salesperson and ageing basis, and set your DSO target.
- ActCall the right customers first and track the cash forecast.
Questions it answers
- How much is overdue, and how much of it is older than 90 days?
- Which customers should we call today, and in what order?
- How much cash can we expect in the next 7 and 30 days?
- Which customers have crossed their credit limit?
- Which branch or salesperson holds the most overdue?
Built around your team
The demo uses fictional sample data. For your team we rebuild it around your own file. Typical changes:
- Your own ageing buckets and DSO target
- Your column names from Tally, SAP or any ERP export
- Branch, region, product or salesperson cuts that match your team
- A one-click Excel call list and your company branding
Who built it
Designed and built by Jitendra Rao, founder of Excel Keys, who has more than 11 years of hands-on experience in MIS reporting, sales analytics and dashboard automation. Every screenshot and demo uses fictional sample data.
Last updated
Frequently asked questions
What is a receivables (collections) dashboard?
It turns an invoice or receivables list into overdue totals, debtors ageing, a ranked call list and a short cash forecast, so a credit-control team knows who to chase first instead of working down the ageing report line by line.
How is the collection health score calculated?
It combines four measures into one 0 to 100 score: the overdue share, DSO compared with your target, the share of receivables beyond 90 days and collection efficiency. The dashboard shows the reasons behind the score.
How does the cash forecast work?
It estimates what is likely to arrive in the next 7 and 30 days from how each customer has paid in the past, so a customer who usually pays 20 days late is expected later than one who pays on time.
Is our data uploaded anywhere?
No. The dashboard is a single file that runs inside your browser. There is no server and no cloud upload, and it works without an internet connection once it is open. Your file never leaves your computer.
What is switched off in the public demo?
Export, print and save are disabled in the public preview, and the data shown is fictional. Filters, charts and file upload all work, so you can test it with your own file. The full working version is built for your team on request.
Can it be built around our own file and KPIs?
Yes. What you see in the demo is a starting point. We rebuild it around your column names, your KPI definitions, your periods and your branding, and agree the exact scope in writing before work starts.