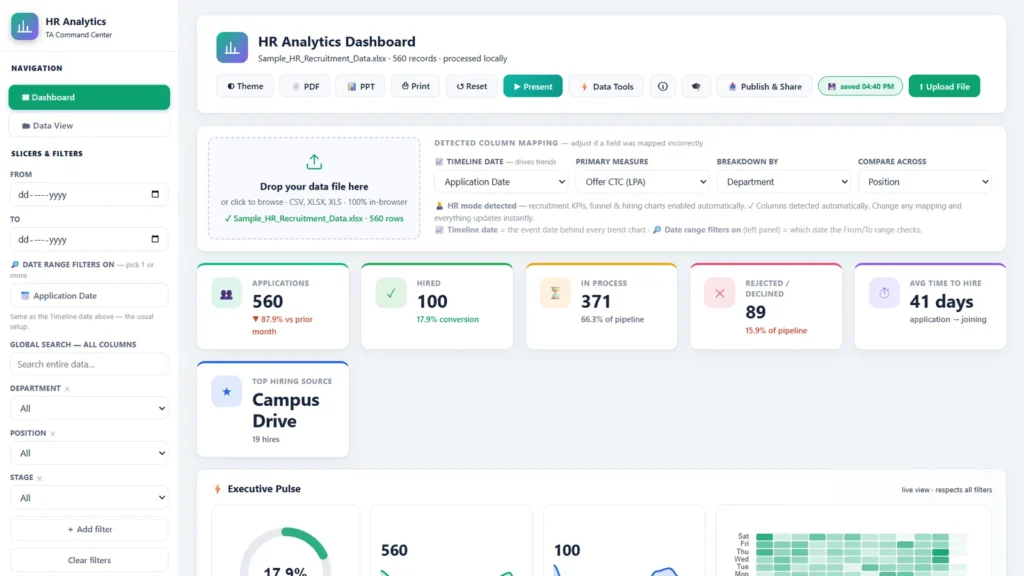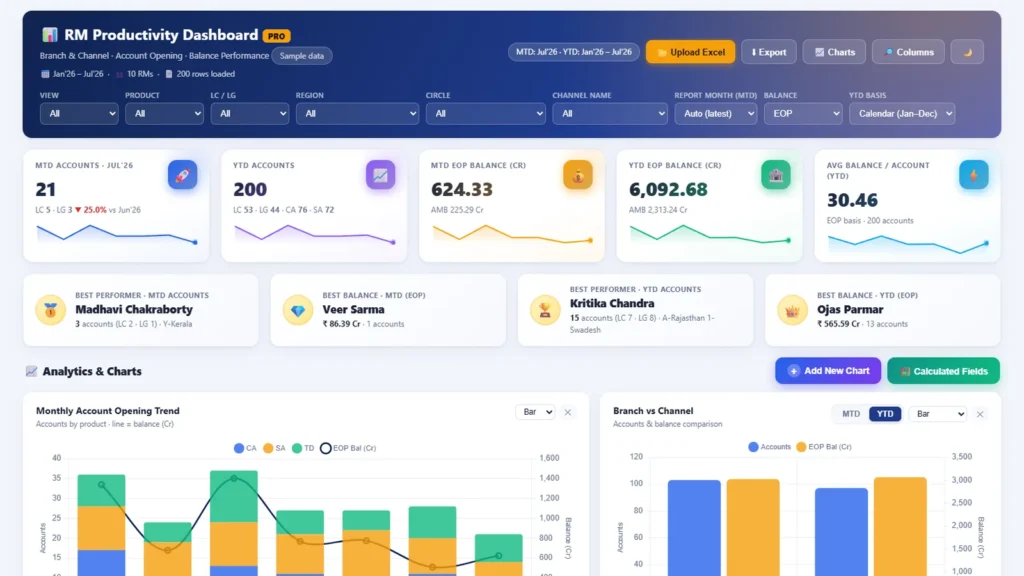
Insurance, Banking & NBFC
Insurance MIS Dashboard
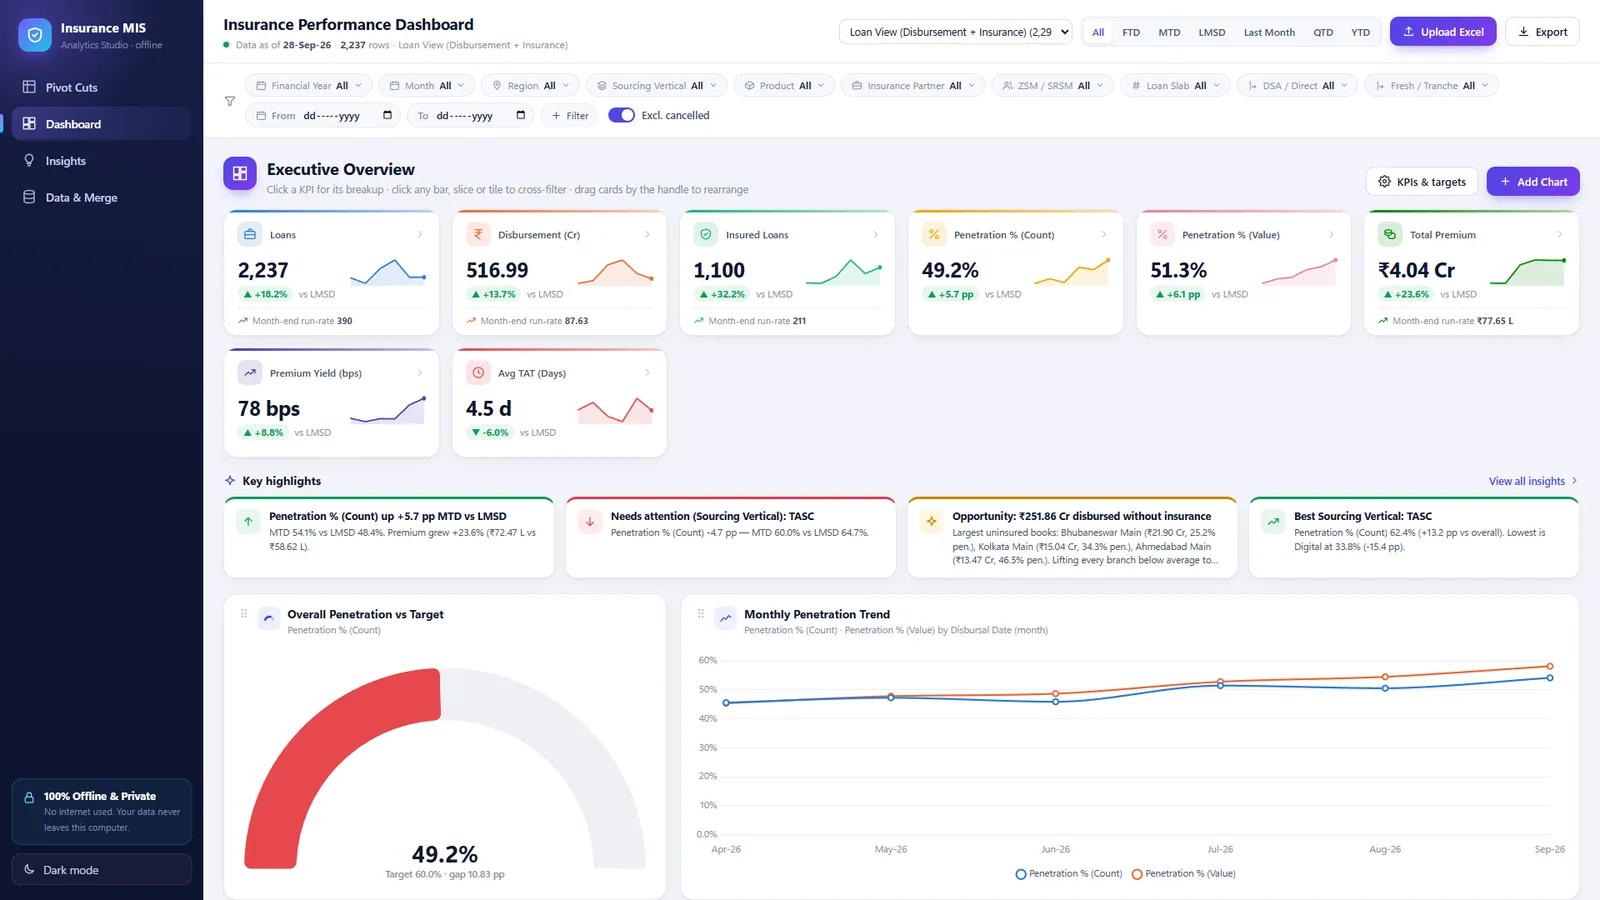
An executive MIS view for loan-linked insurance: penetration, premium, yield and turnaround time, with ready pivot cuts and automatic insights.
The reporting problem
Insurance MIS teams answer the same questions every day: what is the penetration, which vertical or region is behind, how does this month compare with the same day last month. Each answer means another pivot table and another email.
What we built
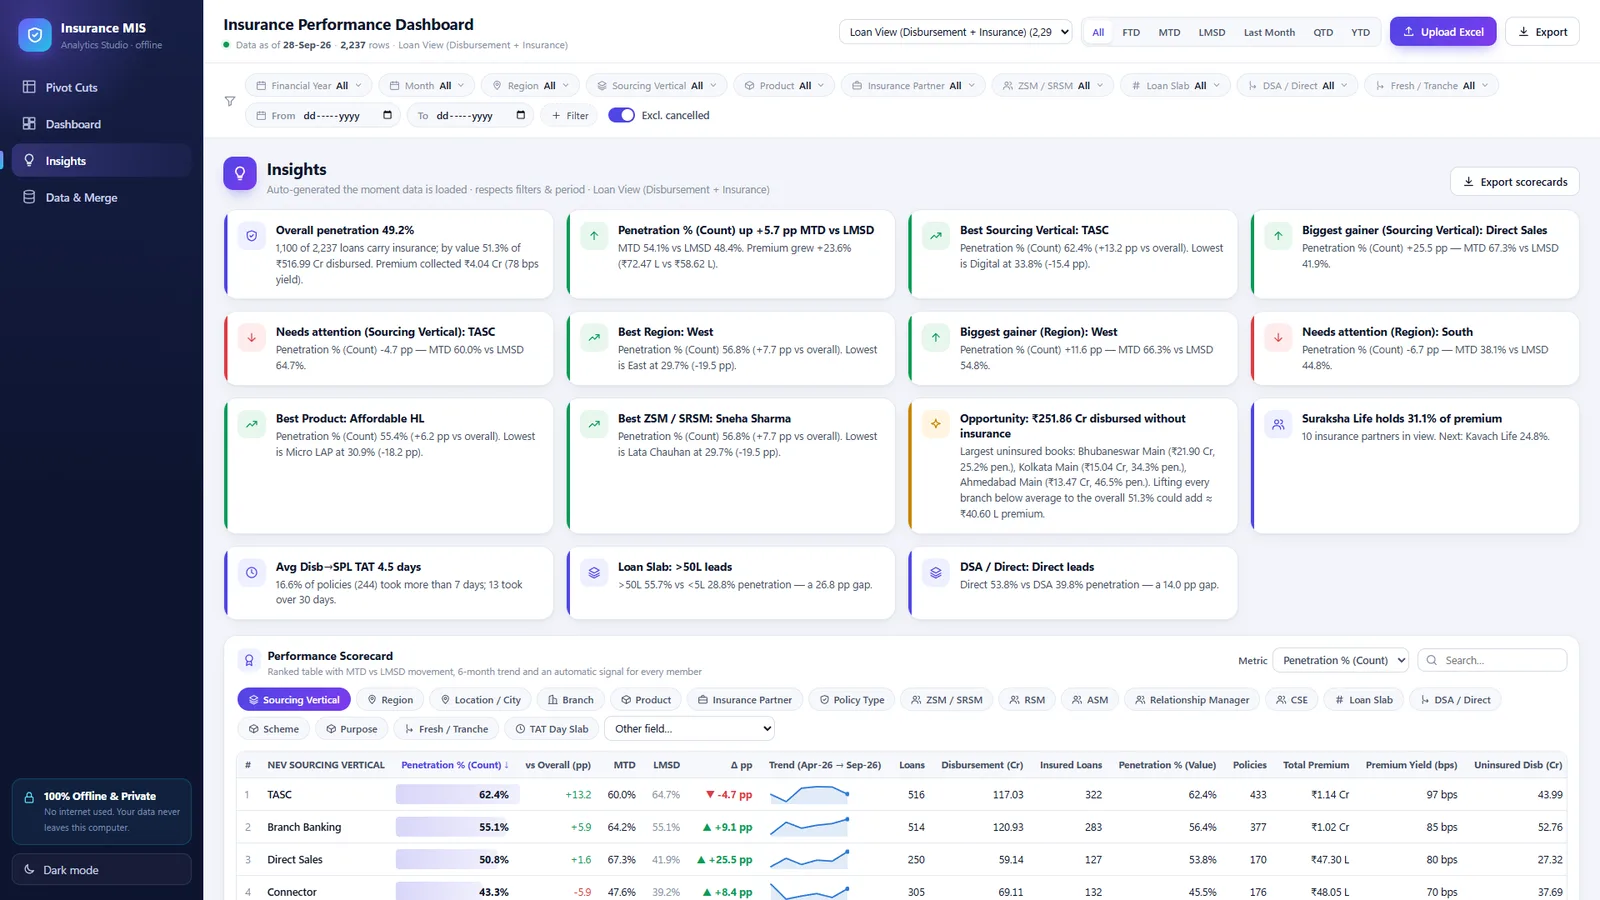
An executive dashboard with four workspaces: Dashboard, Pivot Cuts, Insights and Data. Upload the MIS file and every KPI, cut and chart is recalculated for the period you choose.
Highlights
- Penetration by count and by value, total premium, premium yield and average turnaround time, each with a trend line and growth versus last month.
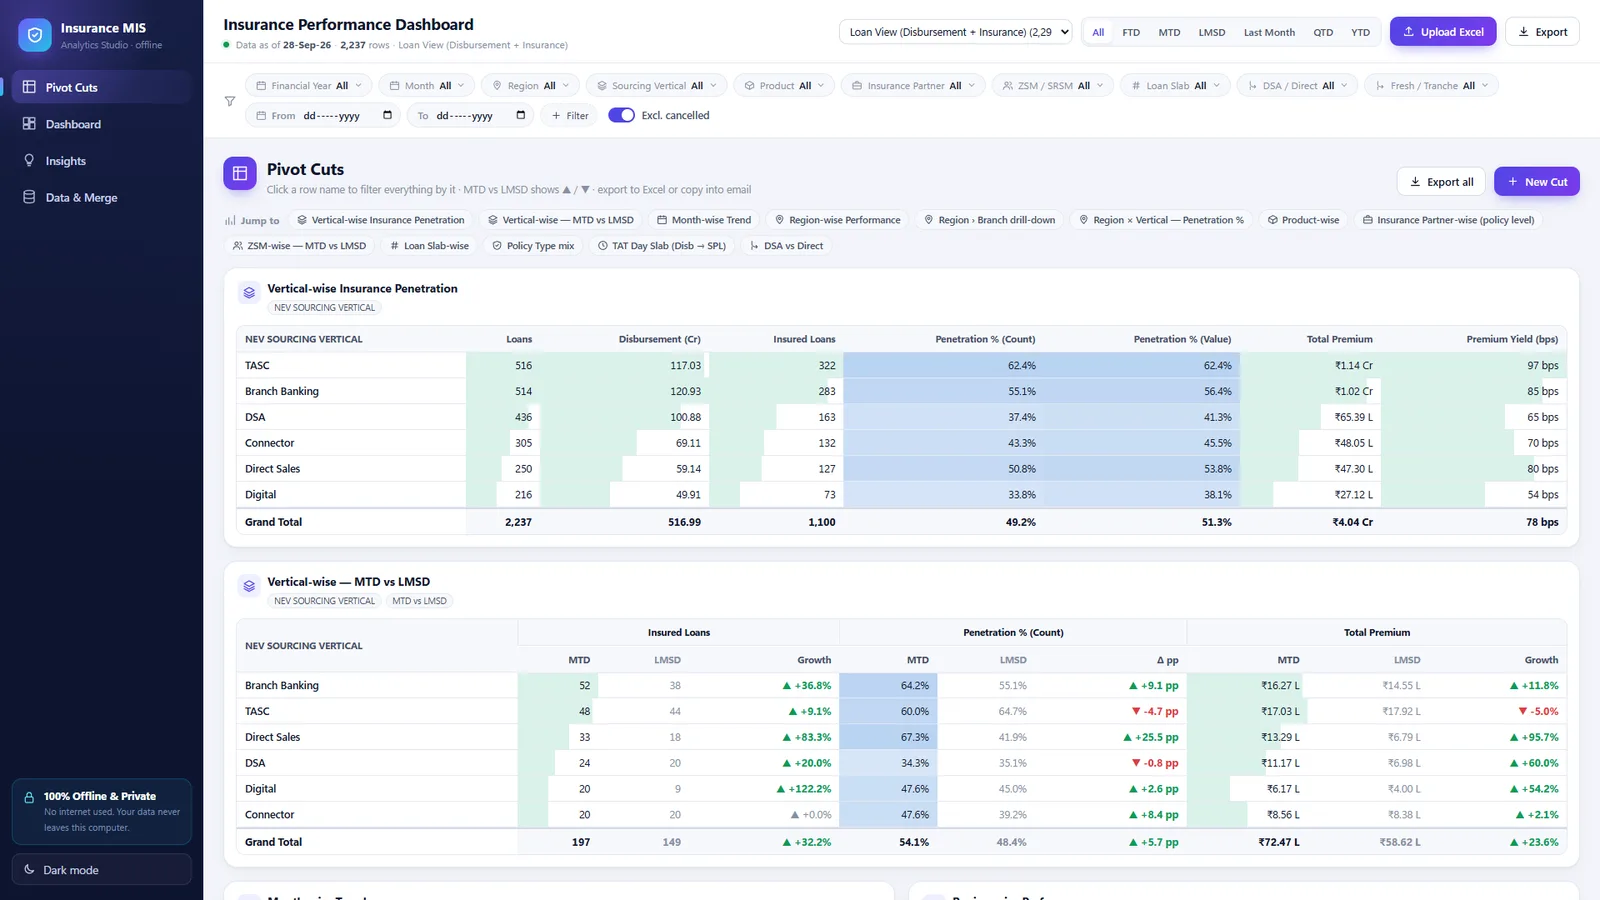
- Thirteen ready pivot cuts with data bars, subtotals and MTD versus LMSD growth, so the daily report is already built.
- Insights written automatically from the data: the best vertical, the region that needs attention and the business disbursed without insurance.
- Click a row or a chart to filter everything else by it, and drag cards to rearrange the page.
Private by design
The dashboard runs fully offline in the browser: no server, no cloud upload and no internet connection needed. Everything shown in these screenshots is fictional sample data.