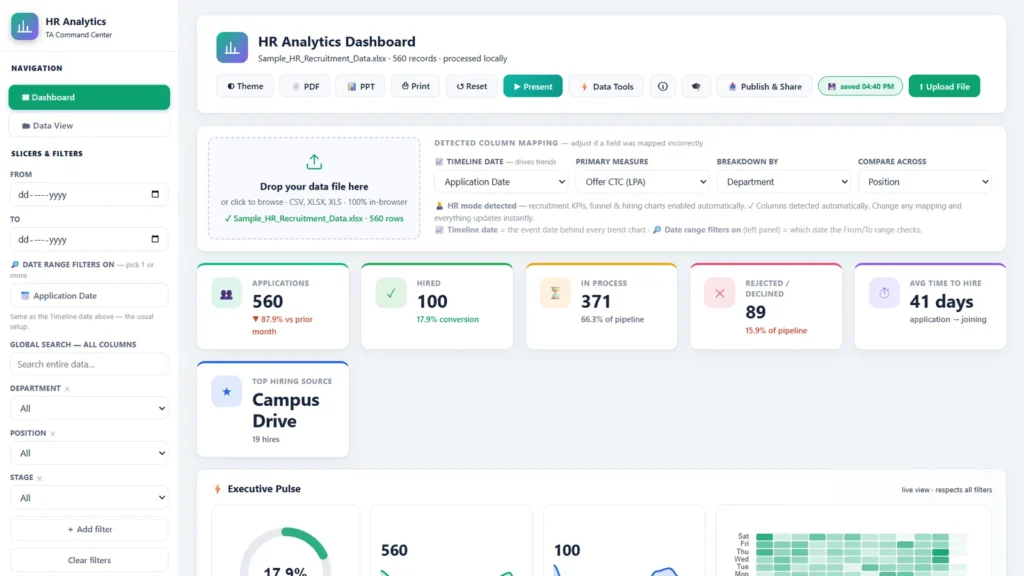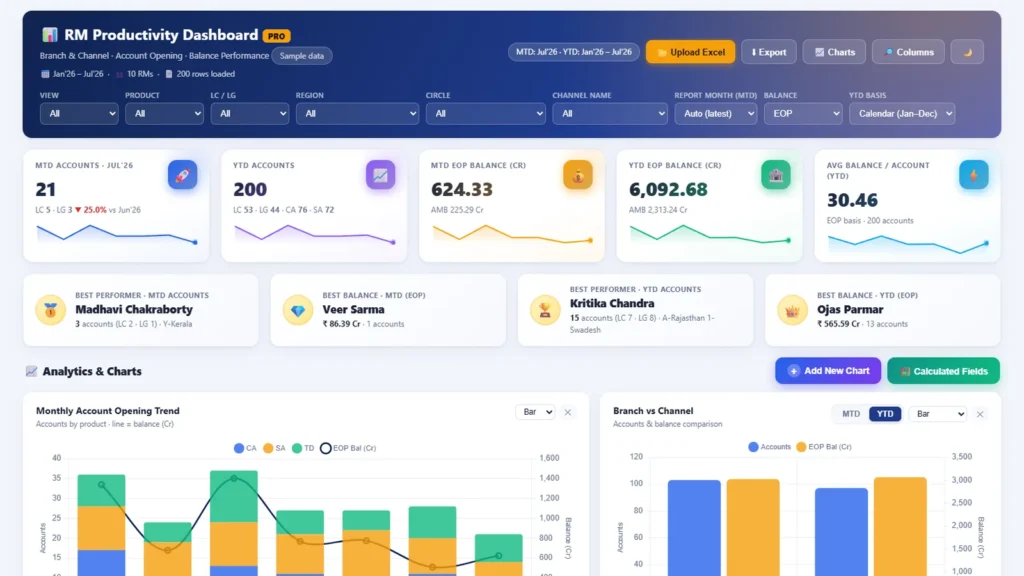
Any team, any dataset
Insight Analyzer
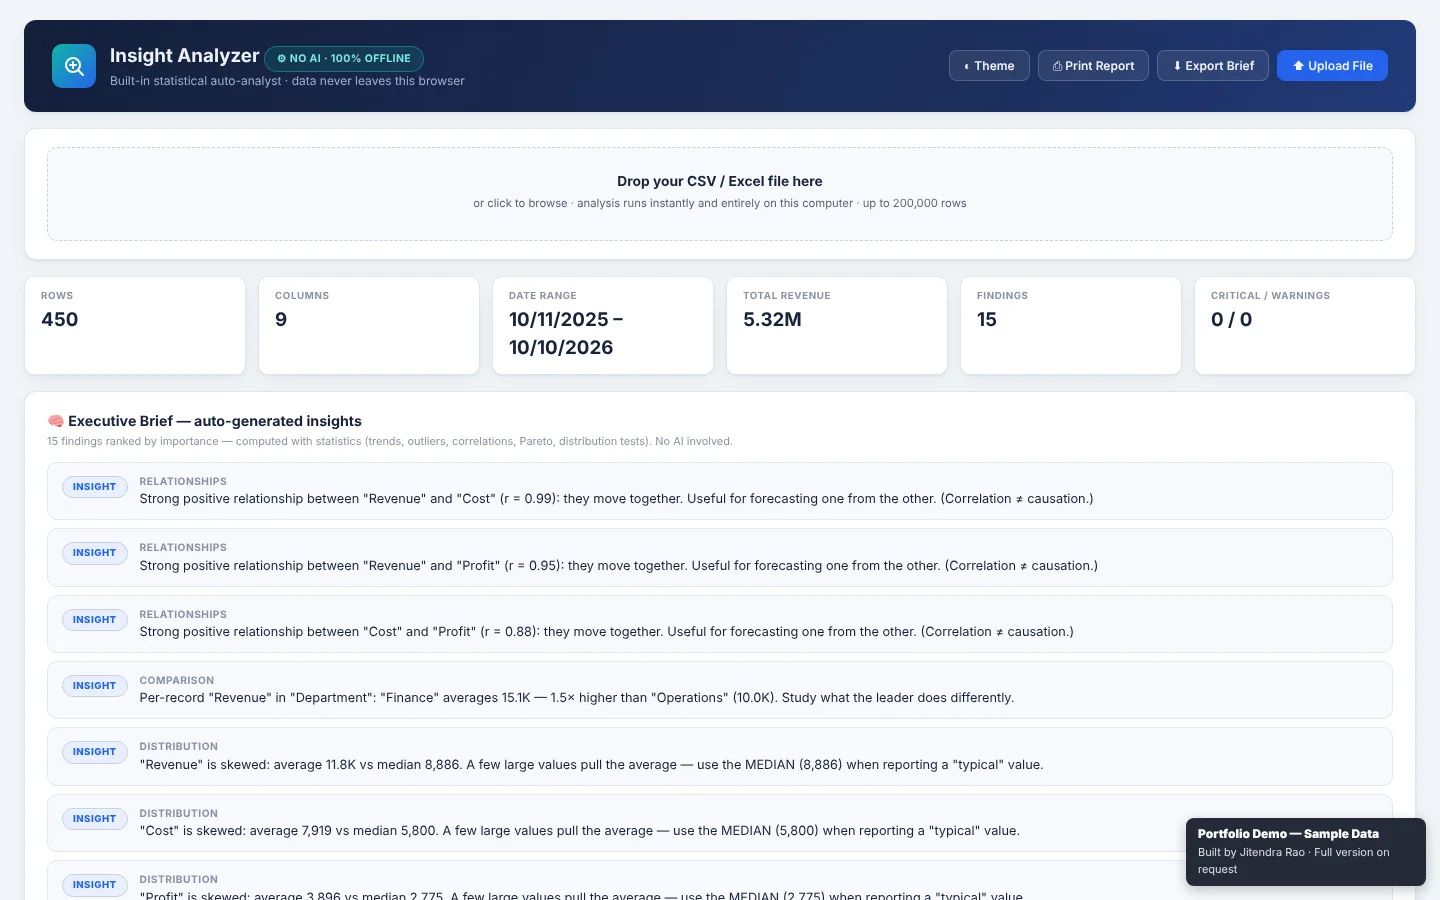
Drop in any spreadsheet and get a ranked statistical brief: correlations, skew, outliers and comparisons explained in plain language.
The reporting problem
A new dataset arrives and nobody knows where to start. Averages hide skew, relationships between columns go unnoticed and outliers quietly distort the totals.
What we built
A statistical engine in a single file. It works with any CSV or Excel sheet: column types, ranges and statistics are detected automatically, and the result is a brief you can read in a minute.
Highlights
- A guided first look: rows, columns, date range and totals the moment the file loads.
- Relationships explained in words, for example that revenue and cost move together.
- Skew detection that tells you when to report the median instead of the average.
- Comparisons across departments or categories, with the leader and the multiple.
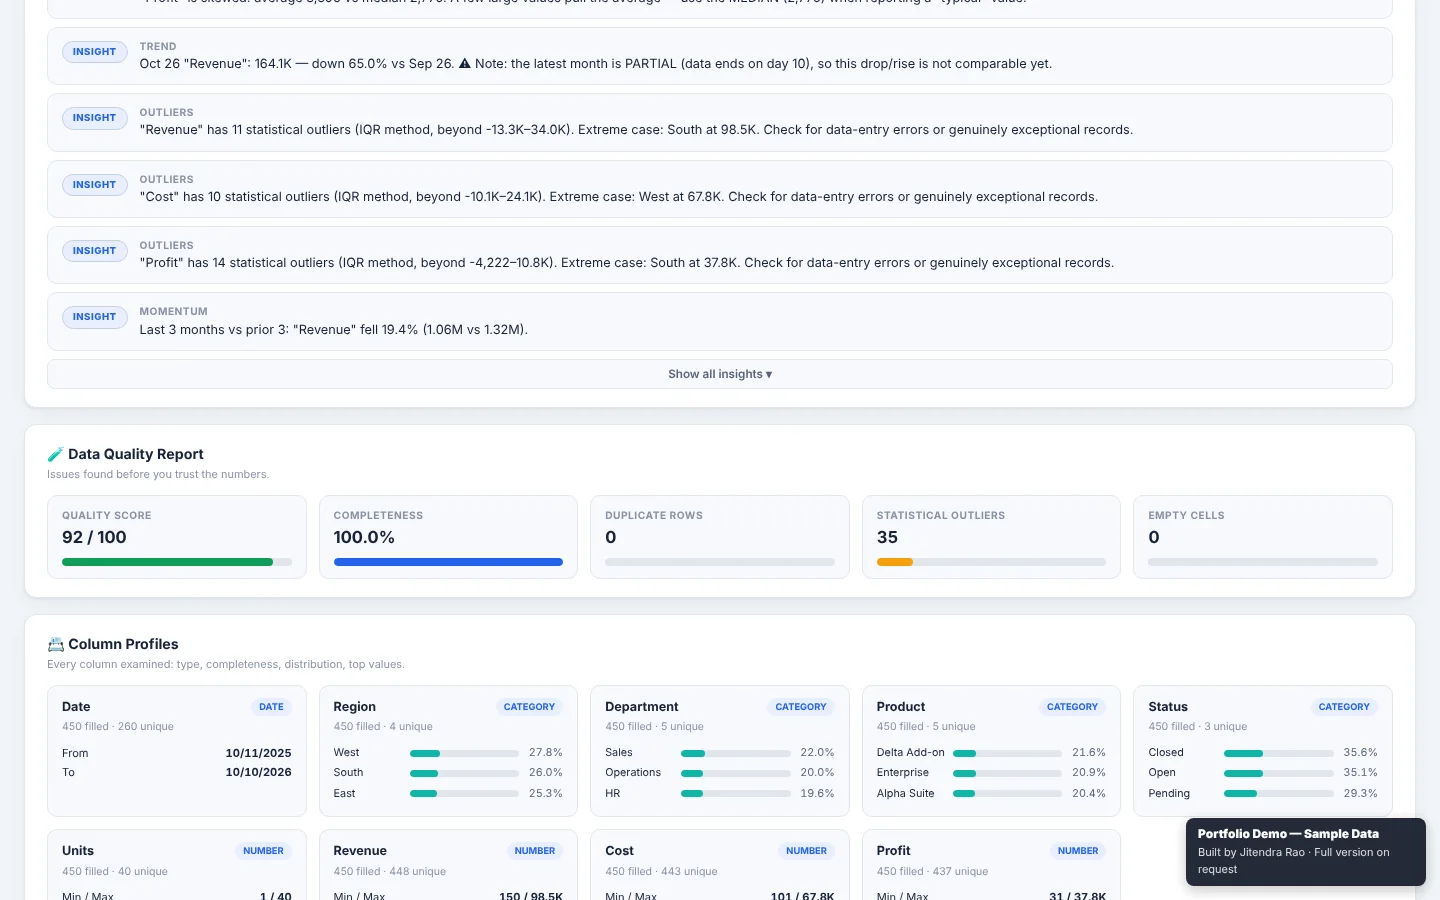
- A data quality score with completeness, duplicate rows and empty cells.
Private by design
The dashboard runs fully offline in the browser: no server, no cloud upload and no internet connection needed. Everything shown in these screenshots is fictional sample data.