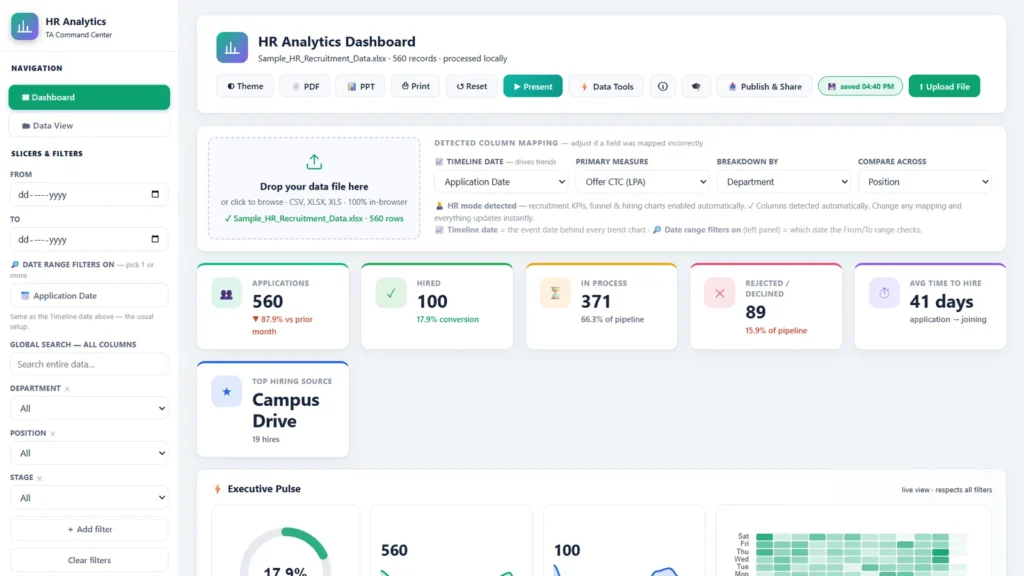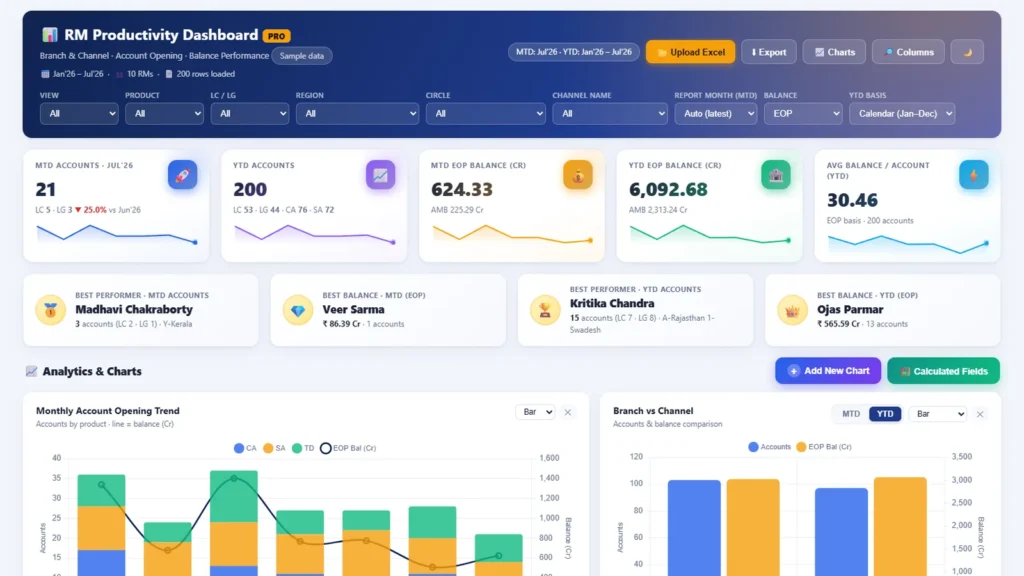
Sales & Business Performance
Business Performance Dashboard
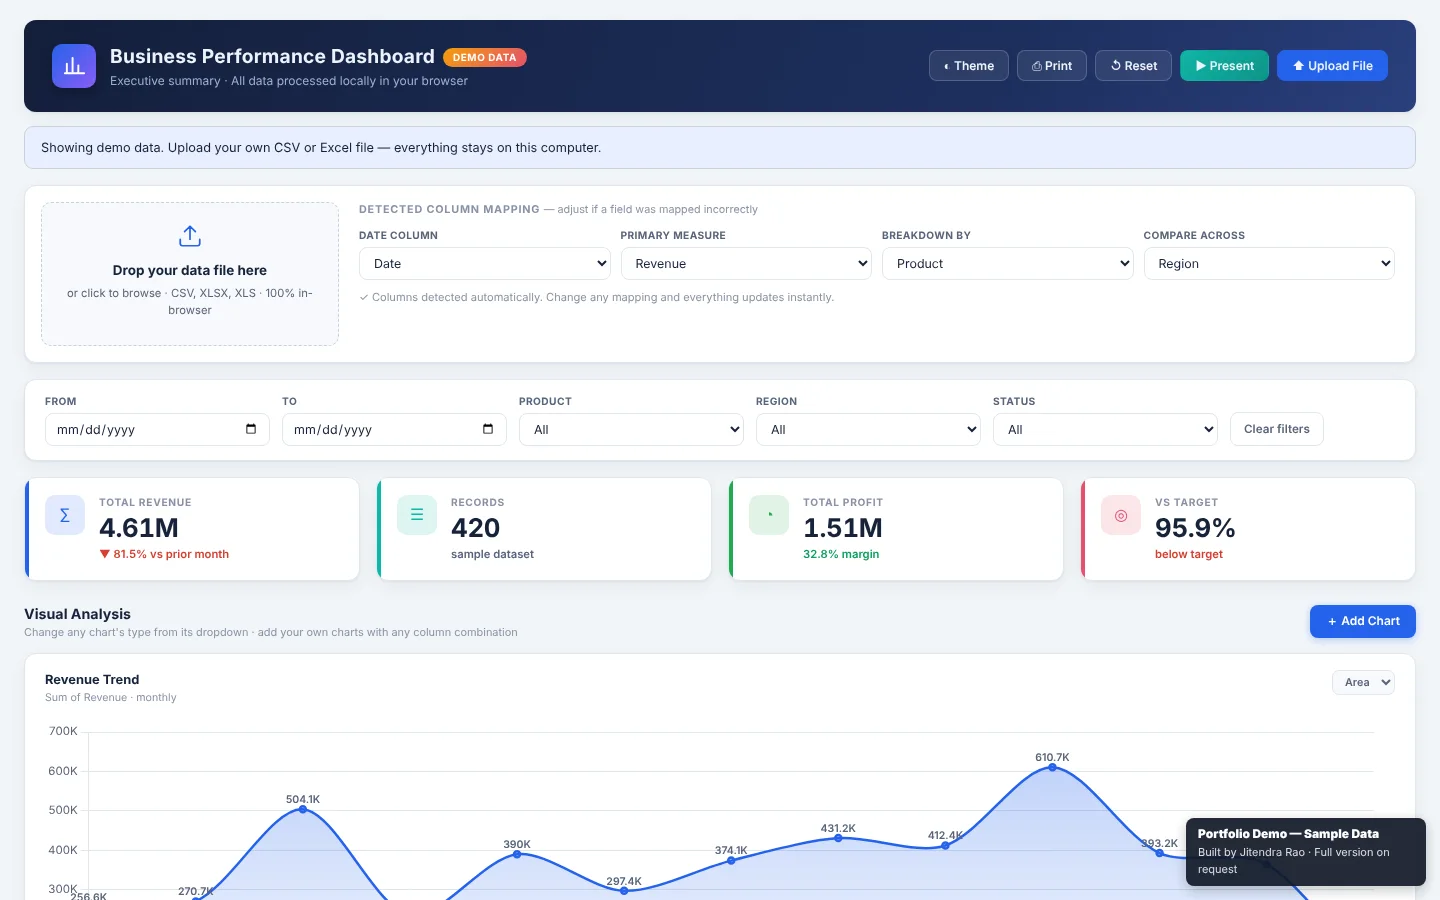
Revenue, profit and target tracking in one upload: automatic KPI cards, charts you can restyle in a click and a presentation mode for leadership reviews.
The reporting problem
Sales and business reviews tend to run on the same charts, rebuilt by hand every cycle. When leadership asks for a different cut of the numbers, someone goes back to the spreadsheet and starts again.
What we built
A dashboard that reads a sales or performance sheet, detects the date, measure and breakdown columns and builds the KPI cards and charts on its own. If it picks the wrong column, you change the mapping from a drop-down and everything updates.
Highlights
- Total revenue, record count, total profit with margin and performance against target, each compared with the previous month.
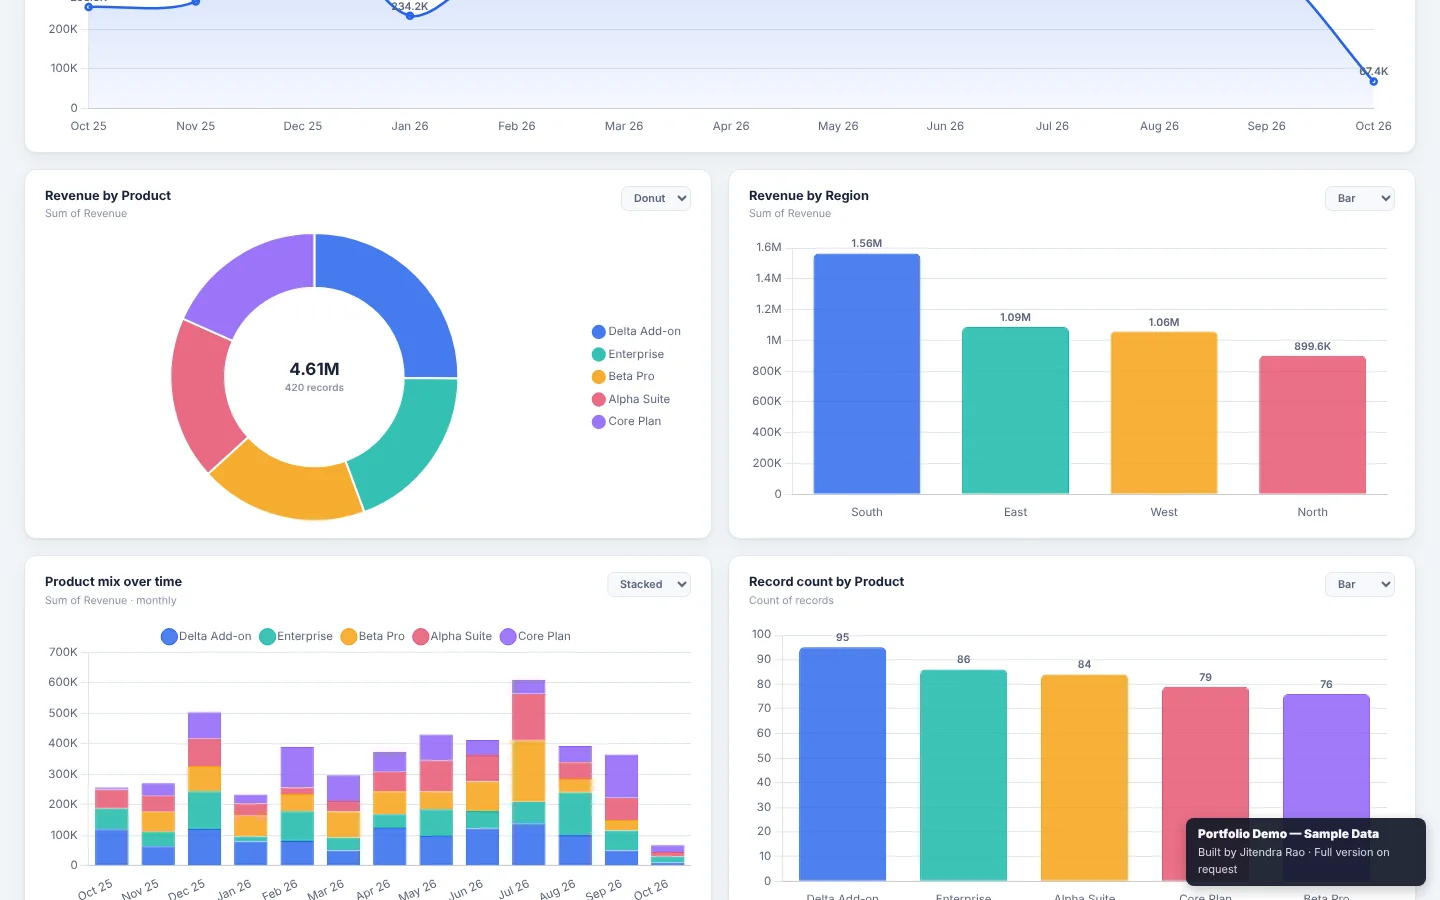
- Revenue trend, revenue by product and region, product mix over time and record counts, ready on load.
- A type selector on every chart, so the same data can be shown as an area, line, bar, doughnut, pie or radar chart.
- Add Chart for any new question, without a BI tool and without formulas.
- Presentation mode for walking leadership through the numbers.
Private by design
The dashboard runs fully offline in the browser: no server, no cloud upload and no internet connection needed. Everything shown in these screenshots is fictional sample data.