Banking & Sales Teams
RM Productivity Dashboard
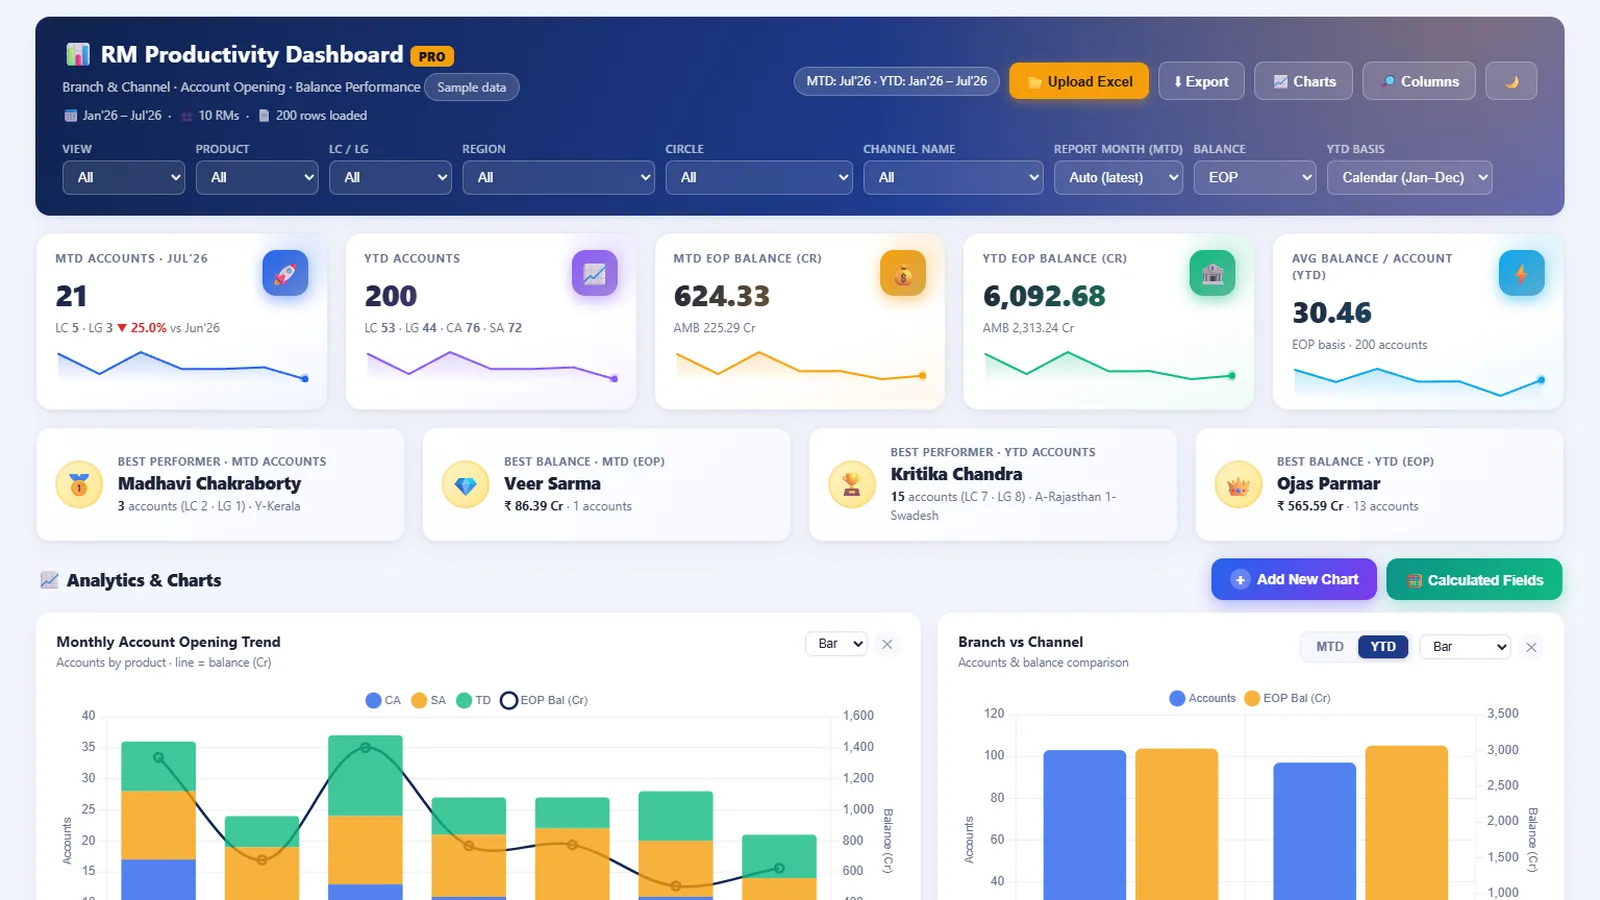
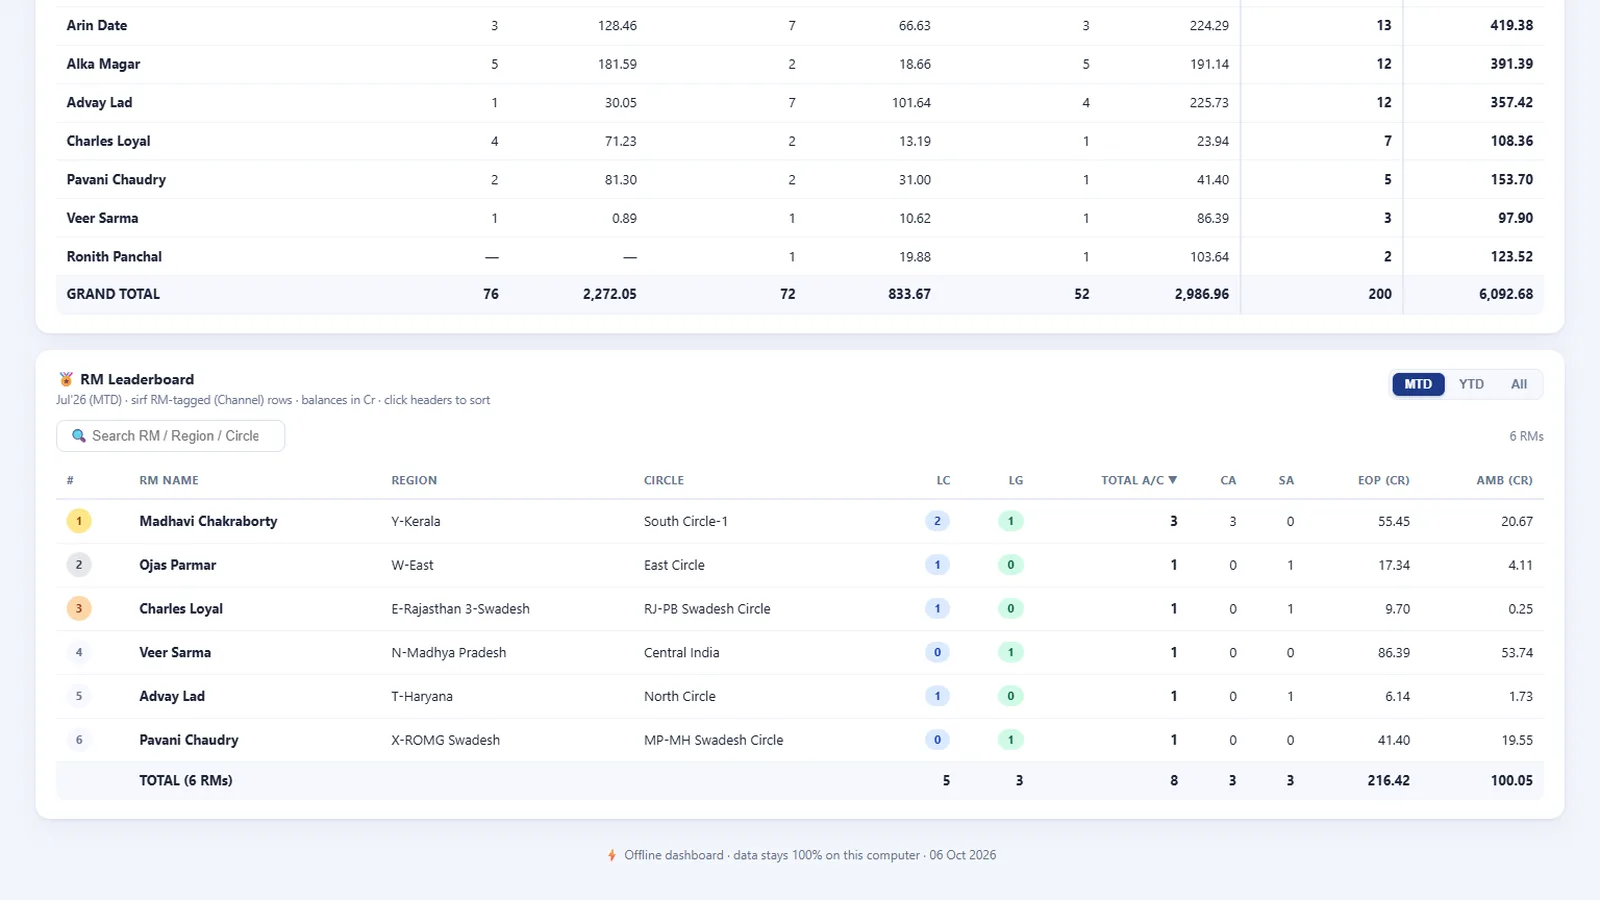
Account opening and balance performance for every relationship manager, with best-performer cards, a pivot table and a ranked leaderboard.
The reporting problem
Every month, sales heads need to know which relationship manager opened how many accounts, how much balance came in and who is falling behind. Building that from raw Excel exports means a full day of pivots, formulas and charts, repeated every month.
What we built
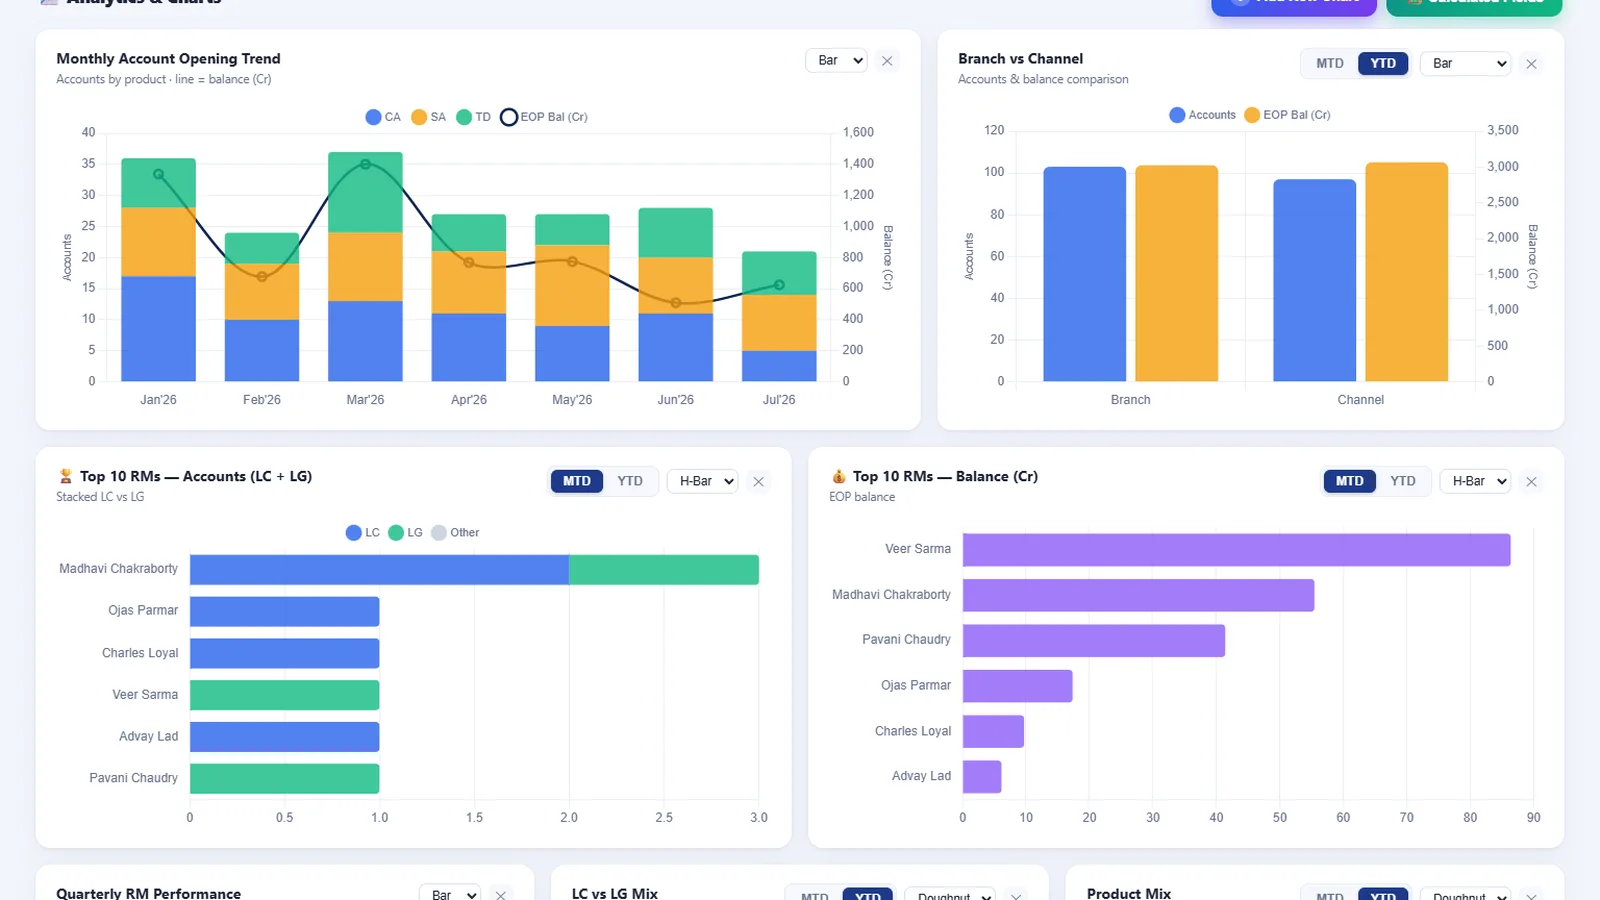
A productivity dashboard that reads the monthly account file, finds the right sheet and header row by itself and refreshes KPIs, charts, pivot and leaderboard in a few seconds. No formula and no macro.
Highlights
- Accounts opened and balances for the month and the year, with the average balance per account.
- Best performers for the month and the year, ready for recognition without digging through data.
- Filters built from the file itself: product, region, circle, channel, report month, calendar or financial year.
- A column-mapping screen for files whose column names change.
- A ranked leaderboard you can search and sort by any column.
Private by design
The dashboard runs fully offline in the browser: no server, no cloud upload and no internet connection needed. Everything shown in these screenshots is fictional sample data.