Founders, Finance & Small Business
Cash Flow & Runway Dashboard
Upload a bank statement or ledger and see how many months of cash are left: runway gauge, burn rate, break-even and a 12-month forecast you can stress-test.
The reporting problem
For a founder or a small business, the cash position is buried in a bank statement. Shortfalls arrive as a surprise, budget what-ifs live in a separate sheet and break-even is a guess.
What we built
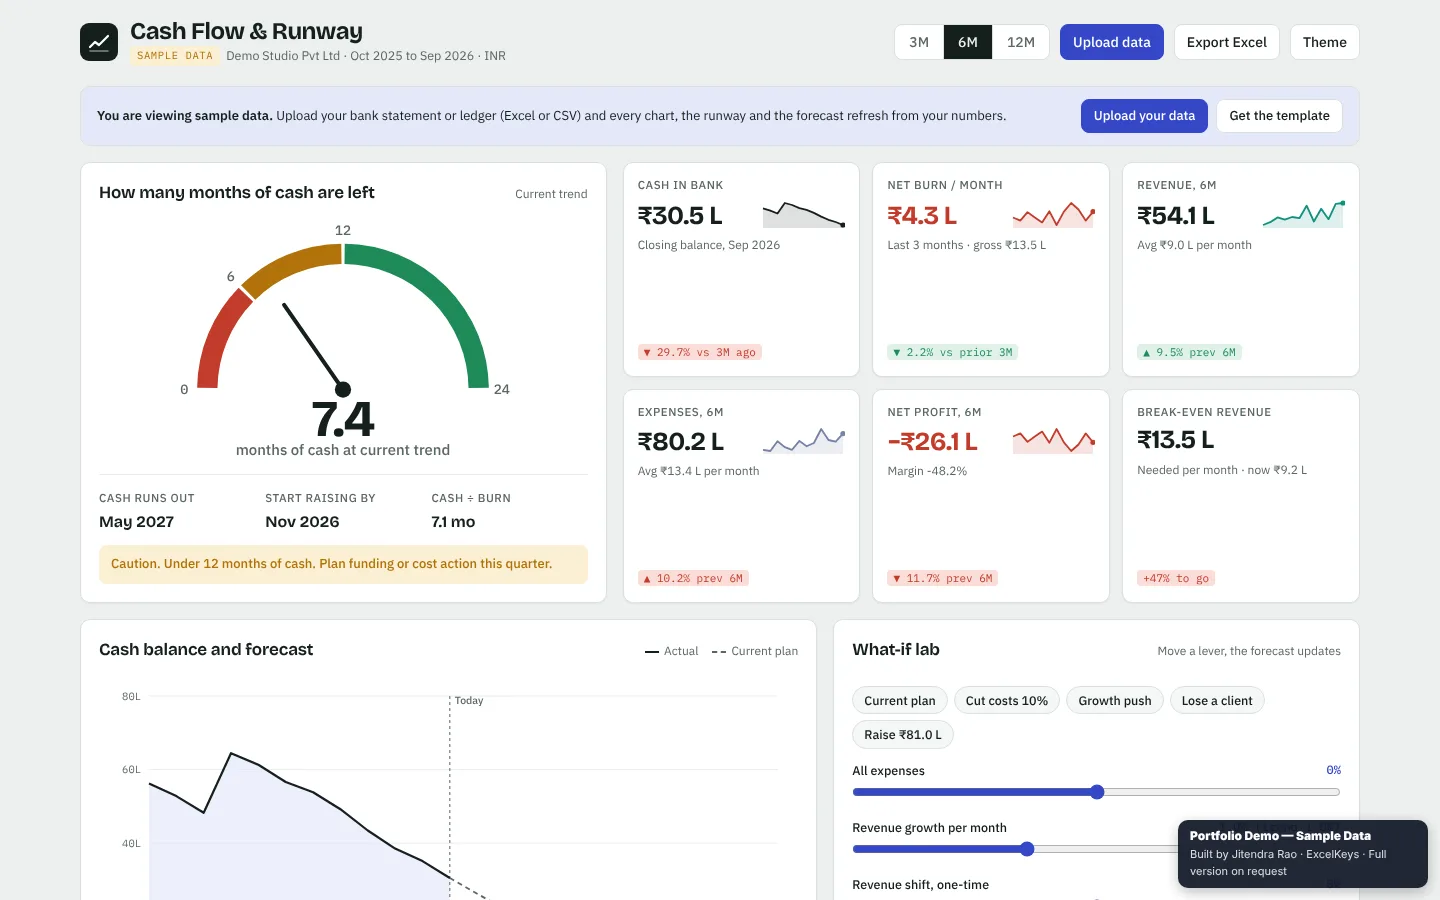
A runway dashboard that reads a bank statement or ledger (.xlsx, .csv or .tsv), detects categories and months from your rows and shows how many months of cash are left at the current trend. Move the levers and the runway and forecast refresh instantly.
Highlights
- A runway gauge with the month cash runs out and the date to start raising funds by.
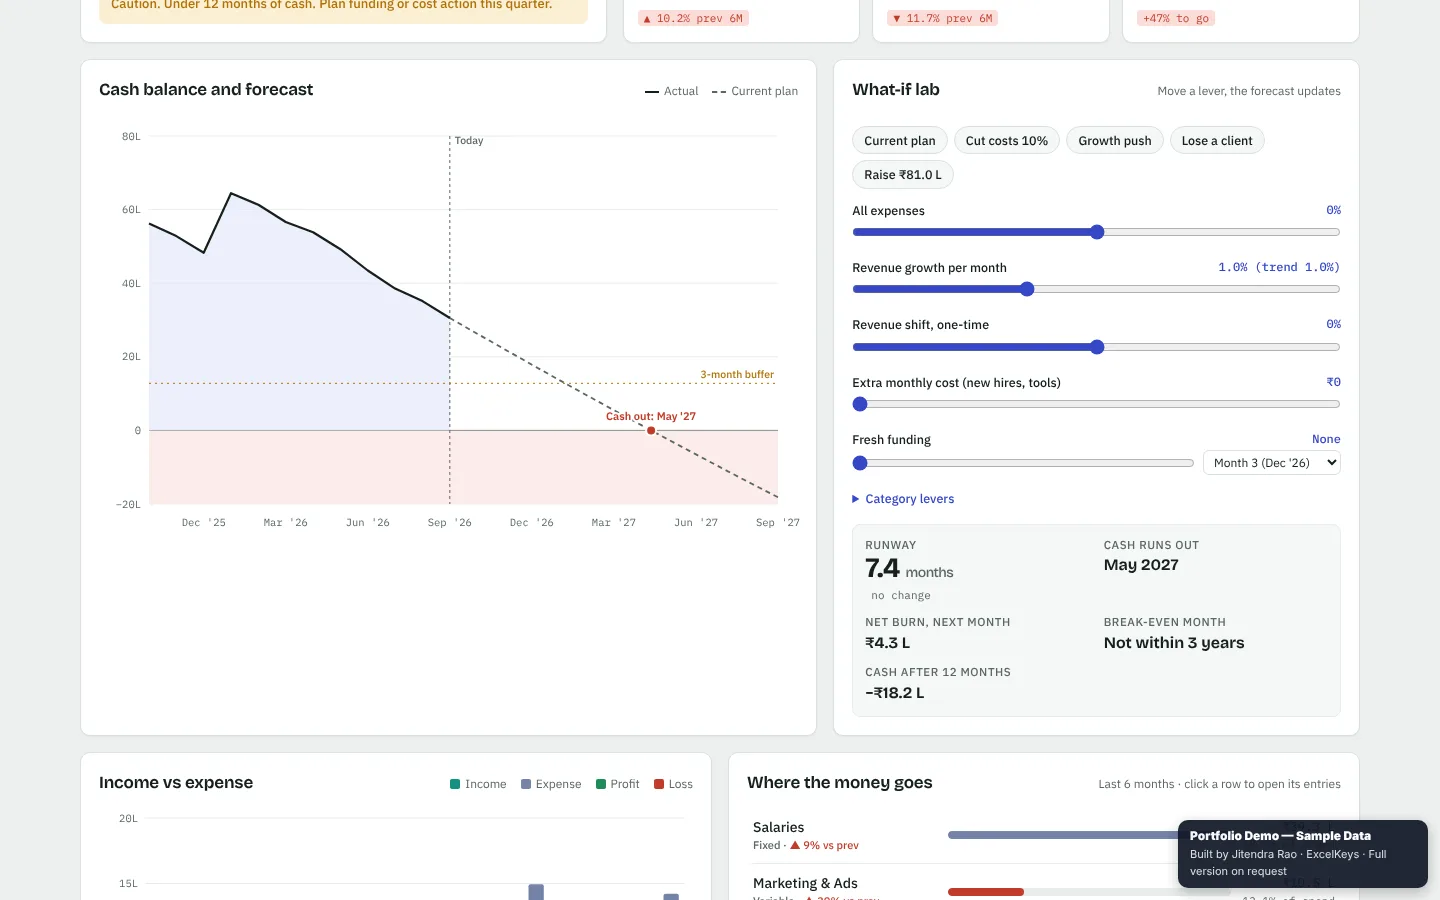
- Actual and projected cash balance with a three-month buffer line and the cash-out point marked.
- A what-if lab with presets such as Cut costs 10%, Growth push, Lose a client and Raise funds, plus sliders for expenses, growth and extra monthly cost.
- Category spend with fixed or variable tags and change versus the previous period. Click a row to open its entries.
- Break-even revenue per month against where you are today, across 3, 6 or 12 months.
Private by design
Financial data is sensitive, so the file is read inside your browser and is never uploaded. The public demo runs on fictional sample data. You can filter, click through every view and even load your own file, while export, print and save are switched off in the demo. The full working version is built for your team on request.
Cash Flow & Runway Dashboard at a glance
- Built for
- Founders, startups, finance leads, agencies and small businesses
- Replaces
- A bank statement read by hand and a separate what-if sheet
- Input
- Your bank statement or ledger as .xlsx, .csv or .tsv
- Output
- Runway gauge, burn, break-even, 12-month forecast and a what-if lab
- Runs
- In the browser, your file is never uploaded
Who it is for
- Founders who need to know how many months of cash are left
- Finance leads who plan hiring and spending against runway
- Agencies whose income depends on a few clients
- Small business owners who want a clear monthly cash picture
What it measures
| Metric | What it tells you |
|---|---|
| Cash in bank | The latest balance from your statement |
| Net burn | Monthly expenses minus monthly revenue |
| Runway | Months of cash left at the current trend |
| Cash-out month | The month the balance reaches zero if nothing changes |
| Break-even revenue | Monthly revenue needed to stop burning cash |
| Spend by category | Where the money goes, fixed against variable, versus the previous period |
How it works
- UploadDrop in your bank statement or ledger, or use the template.
- Auto-detectCategories and months are detected from your rows.
- Stress-testMove the levers or pick a preset such as Cut costs 10% or Lose a client.
- DecideRead the runway, the cash-out month and the date to start raising.
Questions it answers
- How many months of cash do we have left?
- When does the money run out if nothing changes?
- How much revenue do we need each month to break even?
- What happens to runway if we cut costs 10% or lose a client?
- Which spending categories grew the most?
Built around your team
The demo uses fictional sample data. For your team we rebuild it around your own file. Typical changes:
- Your own categories and fixed or variable tags
- Your bank's statement format
- Scenarios that match your business, such as a new hire or a funding round
- Your company name, logo and colours
Who built it
Designed and built by Jitendra Rao, founder of Excel Keys, who has more than 11 years of hands-on experience in MIS reporting, sales analytics and dashboard automation. Every screenshot and demo uses fictional sample data.
Last updated
Frequently asked questions
What is cash runway?
Cash runway is the number of months a business can keep running at its current net burn. It is cash in bank divided by monthly net burn: for example, 12,00,000 rupees in the bank and a net burn of 1,50,000 rupees a month gives a runway of 8 months.
What is net burn?
Net burn is monthly expenses minus monthly revenue. If a business earns 4 lakh and spends 5.5 lakh in a month, its net burn is 1.5 lakh.
Can I test scenarios?
Yes. The what-if lab has presets such as Cut costs 10%, Growth push, Lose a client and Raise funds, plus sliders for expenses, growth and extra monthly cost. The runway and forecast refresh instantly.
Is our data uploaded anywhere?
No. The dashboard is a single file that runs inside your browser. There is no server and no cloud upload, and it works without an internet connection once it is open. Your file never leaves your computer.
What is switched off in the public demo?
Export, print and save are disabled in the public preview, and the data shown is fictional. Filters, charts and file upload all work, so you can test it with your own file. The full working version is built for your team on request.
Can it be built around our own file and KPIs?
Yes. What you see in the demo is a starting point. We rebuild it around your column names, your KPI definitions, your periods and your branding, and agree the exact scope in writing before work starts.