Retail, Distribution & Inventory
StockPulse Inventory Dashboard
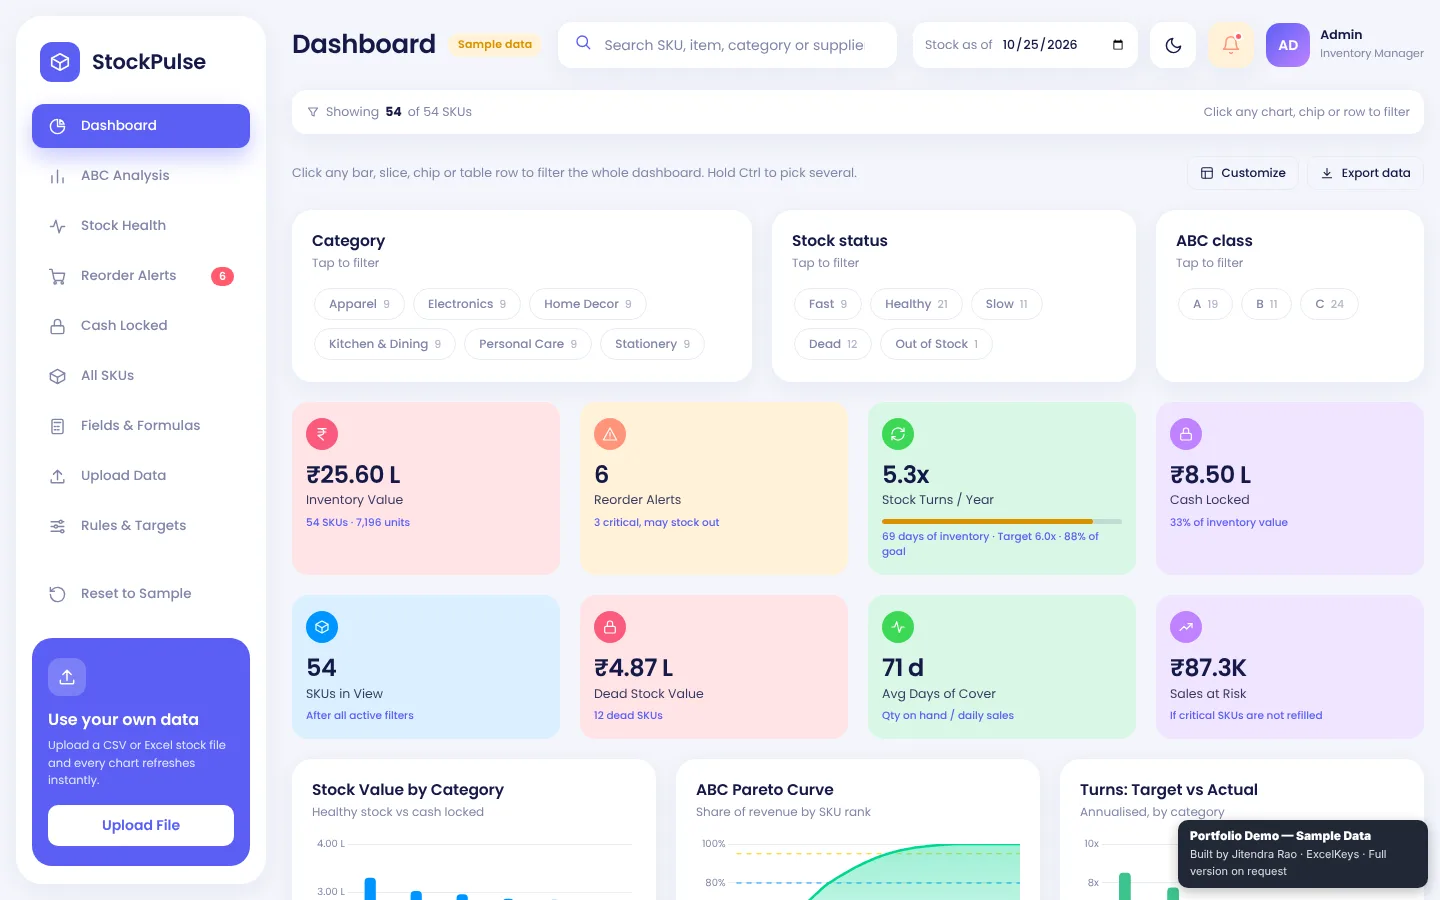
Upload a stock file and see what to reorder, what is dead and how much cash is locked: ABC analysis, stock health, reorder alerts and click-to-filter charts.
The reporting problem
Stock lists rarely show priorities. Stock-outs are found too late, cash sits in slow-moving items, and the formulas in the inventory sheet cannot be changed without breaking it.
What we built
An inventory dashboard that reads a stock file (.csv, .xlsx or .xls), classifies every SKU and shows what to reorder, what to clear and how much cash is locked. Sensible defaults are included, and every threshold, target and formula can be tuned.
Highlights
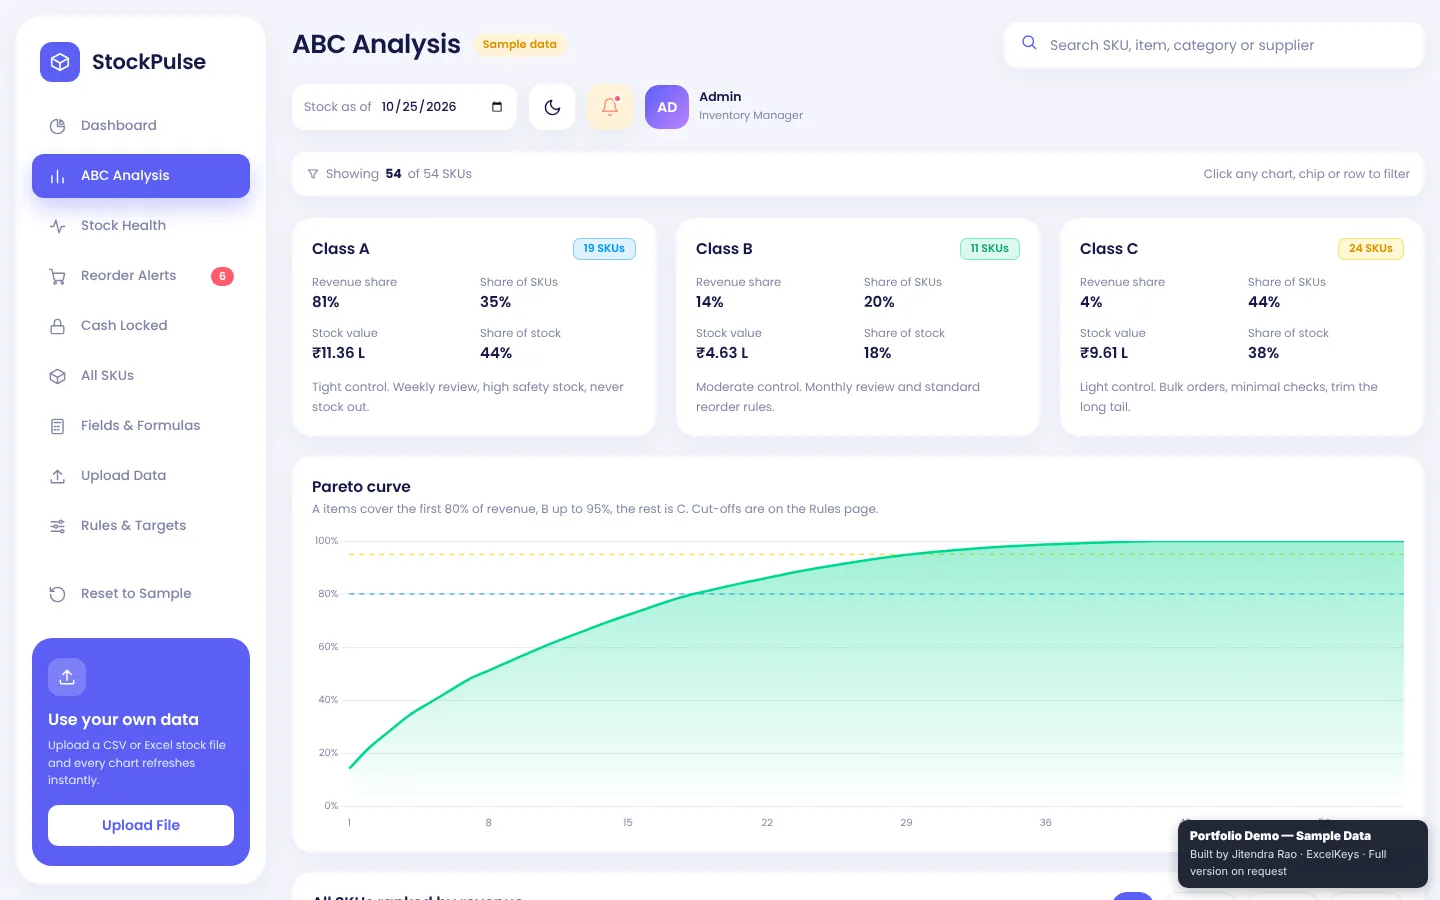
- ABC analysis that shows the few SKUs driving 80% of revenue, with revenue share, stock share and the control level for each class.
- Stock health for every SKU, with stock ageing by days since the last sale.
- Critical and reorder items sorted by urgency, with days of cover and a suggested order quantity.
- Dead stock and excess slow stock valued in rupees, plus the sales at risk if critical SKUs are not refilled.
- Click to filter everything. Hold Ctrl to pick several items at once.
Private by design
The page makes no network calls, so your stock file stays on your computer. The public demo runs on fictional sample data. You can filter, click through every view and even load your own file, while export, print and save are switched off in the demo. The full working version is built for your team on request.
StockPulse Inventory Dashboard at a glance
- Built for
- Inventory managers, retailers, distributors, operations and procurement
- Replaces
- A stock list with no priorities and formulas nobody dares to change
- Input
- Your stock file as .csv, .xlsx or .xls
- Output
- Stock health, ABC Pareto, reorder alerts, cash locked and stock turns
- Runs
- Offline in the browser, no network calls
Who it is for
- Inventory managers who decide what to reorder every week
- Retailers and distributors with cash tied up in slow stock
- Procurement teams who need a suggested order quantity
- Operations heads who track stock turns against a target
What it measures
| Metric | What it tells you |
|---|---|
| Inventory value | Total value of stock on hand |
| Stock health class | Every SKU tagged Fast, Healthy, Slow, Dead or Out of Stock |
| ABC class | The few SKUs that drive about 80% of revenue (A), the middle (B) and the long tail (C) |
| Days of cover | How many days current stock lasts at the recent sales rate |
| Suggested order quantity | How much to reorder for items below their reorder point |
| Cash locked | Value of dead and excess slow stock |
| Stock turns | How many times stock is sold and replaced, actual against target |
How it works
- UploadDrop in your stock file (.csv, .xlsx or .xls).
- ClassifyEvery SKU gets a health class and an ABC class.
- FilterClick any bar, slice, chip or row, and hold Ctrl to pick several.
- TuneChange thresholds, targets and formulas on the Rules & Targets and Fields & Formulas pages.
Questions it answers
- What should we reorder now, and how much?
- Which SKUs are dead stock, and how much cash is locked in them?
- Which few SKUs drive most of our revenue?
- Which categories turn slower than target?
- What sales are at risk if critical items are not refilled?
Built around your team
The demo uses fictional sample data. For your team we rebuild it around your own file. Typical changes:
- Your own health thresholds and ABC cut-offs
- Reorder rules that match your lead times
- Cuts by store, warehouse, brand or supplier
- Your company name, logo and colours
Who built it
Designed and built by Jitendra Rao, founder of Excel Keys, who has more than 11 years of hands-on experience in MIS reporting, sales analytics and dashboard automation. Every screenshot and demo uses fictional sample data.
Last updated
Frequently asked questions
What is ABC analysis in inventory?
ABC analysis ranks SKUs by their share of revenue. Class A is the small group that brings about 80% of revenue and needs the tightest control, class B is the middle and class C is the long tail.
What is days of cover?
Days of cover is stock on hand divided by the average daily sales. If you hold 300 units and sell 10 a day, you have 30 days of cover.
Can we change the rules?
Yes. Every threshold, target and formula can be changed on the Rules & Targets and Fields & Formulas pages, so the dashboard follows your own policy.
Is our data uploaded anywhere?
No. The dashboard is a single file that runs inside your browser. There is no server and no cloud upload, and it works without an internet connection once it is open. Your file never leaves your computer.
What is switched off in the public demo?
Export, print and save are disabled in the public preview, and the data shown is fictional. Filters, charts and file upload all work, so you can test it with your own file. The full working version is built for your team on request.
Can it be built around our own file and KPIs?
Yes. What you see in the demo is a starting point. We rebuild it around your column names, your KPI definitions, your periods and your branding, and agree the exact scope in writing before work starts.