Retail, Procurement & Warehousing
Stock Radar: Purchase Planning Dashboard
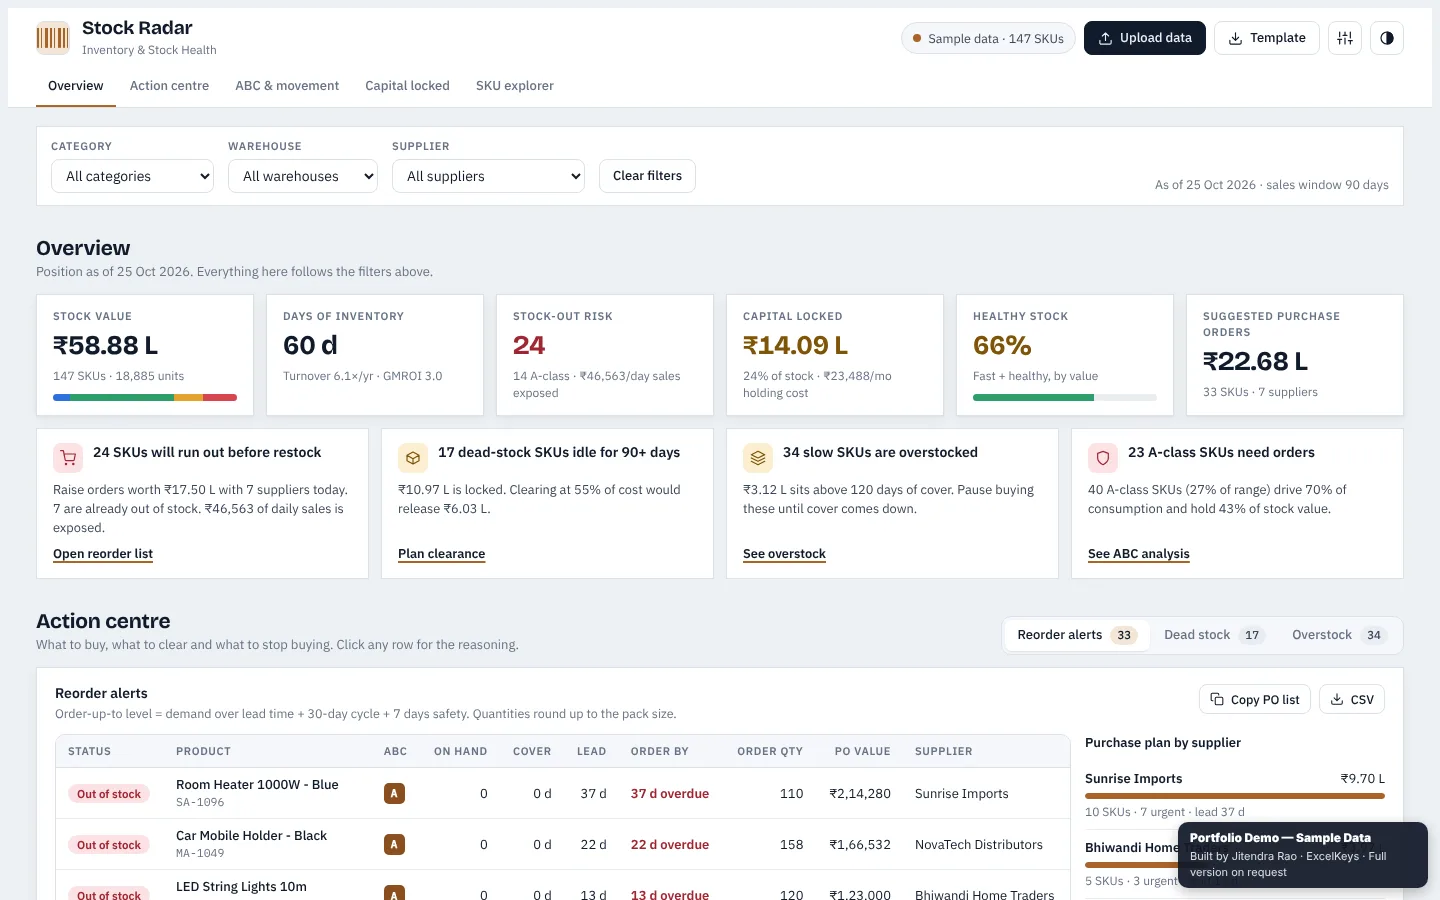
Upload a stock and sales file and know what to buy, what to clear and what to stop buying: reorder alerts, a purchase plan by supplier and capital locked, with the reasoning behind every row.
The reporting problem
Reorder lists are often built by gut feel. Dead stock nobody clears keeps capital locked, overstocked items keep getting reordered and purchase orders are typed up by hand.
What we built
A purchase planning dashboard that reads a stock and sales file (.csv, .xlsx or .tsv, or the template) over a 90-day sales window. The Overview and Action Centre refresh instantly, and you can filter by category, warehouse or supplier.
Highlights
- An order-up-to level from demand over lead time, a 30-day cycle and safety days.
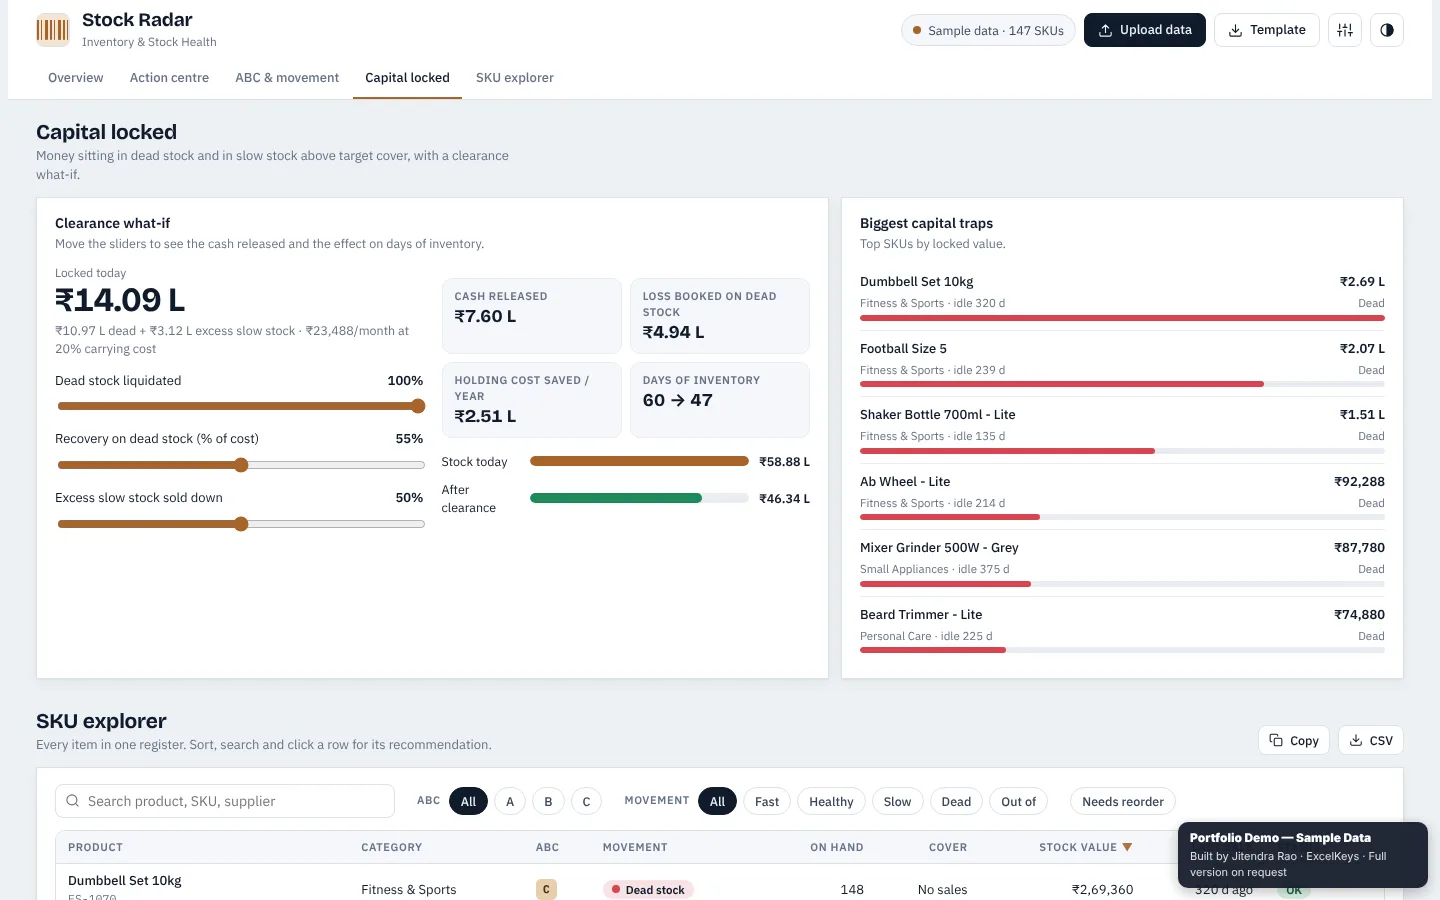
- A dead stock list with the cash that clearing at a discount would release, and an overstock list to pause buying until cover comes down.
- A purchase plan by supplier that you can copy as a PO list.
- ABC and movement analysis that shows which SKUs drive consumption and how fast each one moves.
- Click any row to see the reasoning behind it.
Private by design
Your stock file is processed inside your browser and is never uploaded. The public demo runs on fictional sample data. You can filter, click through every view and even load your own file, while export, print and save are switched off in the demo. The full working version is built for your team on request.
Stock Radar: Purchase Planning Dashboard at a glance
- Built for
- Retailers, distributors, warehouse teams, procurement and D2C brands
- Replaces
- Reorder lists by gut feel and purchase orders typed by hand
- Input
- Your stock and sales file as .csv, .xlsx or .tsv
- Output
- Five views, reorder, dead stock and overstock lists, and a purchase plan by supplier
- Runs
- In the browser, your file is never uploaded
Who it is for
- Procurement teams who raise purchase orders every week
- Retailers and D2C brands who want fewer stock-outs
- Warehouse teams who need to clear dead and excess stock
- Distributors who buy from many suppliers
What it measures
| Metric | What it tells you |
|---|---|
| Stock value | Total value of stock on hand |
| Days of inventory | How long current stock lasts at the 90-day sales rate |
| Stock-out risk | SKUs likely to run out before new stock arrives |
| Capital locked | Cash tied up in dead and overstocked items |
| Order-up-to level | Demand over the lead time plus a 30-day cycle and safety days |
| Suggested purchase | Quantity to order per SKU, grouped by supplier |
How it works
- UploadDrop in your stock and sales file, or use the template.
- ReviewThe Overview and Action Centre refresh instantly.
- FilterNarrow down by category, warehouse or supplier.
- Buy and clearCopy the PO list by supplier and test the clearance what-if.
Questions it answers
- What should we buy this week, and from which supplier?
- Which items will run out before new stock arrives?
- How much cash is locked in dead stock and overstock?
- How much cash would a clearance sale release?
- Why is this SKU on the reorder list?
Built around your team
The demo uses fictional sample data. For your team we rebuild it around your own file. Typical changes:
- Your own lead times, cycle and safety days
- Supplier, warehouse and category cuts that match your business
- PO list formats your team already uses
- Your company name, logo and colours
Who built it
Designed and built by Jitendra Rao, founder of Excel Keys, who has more than 11 years of hands-on experience in MIS reporting, sales analytics and dashboard automation. Every screenshot and demo uses fictional sample data.
Last updated
Frequently asked questions
How is the reorder quantity calculated?
The dashboard sets an order-up-to level from average daily demand over the lead time, plus a 30-day cycle and safety days, then suggests how much to order to get back to that level. For example, at 5 units a day, a 10-day lead time and 7 safety days, the level is 5 x (10 + 30 + 7) = 235 units.
What sales period does it use?
A 90-day sales window, so the demand rate follows recent sales rather than a single month.
Can I see why an item was flagged?
Yes. Click any row to see the reasoning behind it.
Is our data uploaded anywhere?
No. The dashboard is a single file that runs inside your browser. There is no server and no cloud upload, and it works without an internet connection once it is open. Your file never leaves your computer.
What is switched off in the public demo?
Export, print and save are disabled in the public preview, and the data shown is fictional. Filters, charts and file upload all work, so you can test it with your own file. The full working version is built for your team on request.
Can it be built around our own file and KPIs?
Yes. What you see in the demo is a starting point. We rebuild it around your column names, your KPI definitions, your periods and your branding, and agree the exact scope in writing before work starts.