Sales & Revenue Teams
Pipeline Radar: Sales Forecast Dashboard
Import a CRM export and see what the pipeline will really close: quarter forecast, the biggest funnel leak, at-risk deals and a what-if planner for sales leaders.
The reporting problem
A big pipeline number means little on its own. Sales leaders need to know what will actually close this quarter, where deals die in the funnel and which deals have gone quiet, without building a new forecast model every week.
What we built
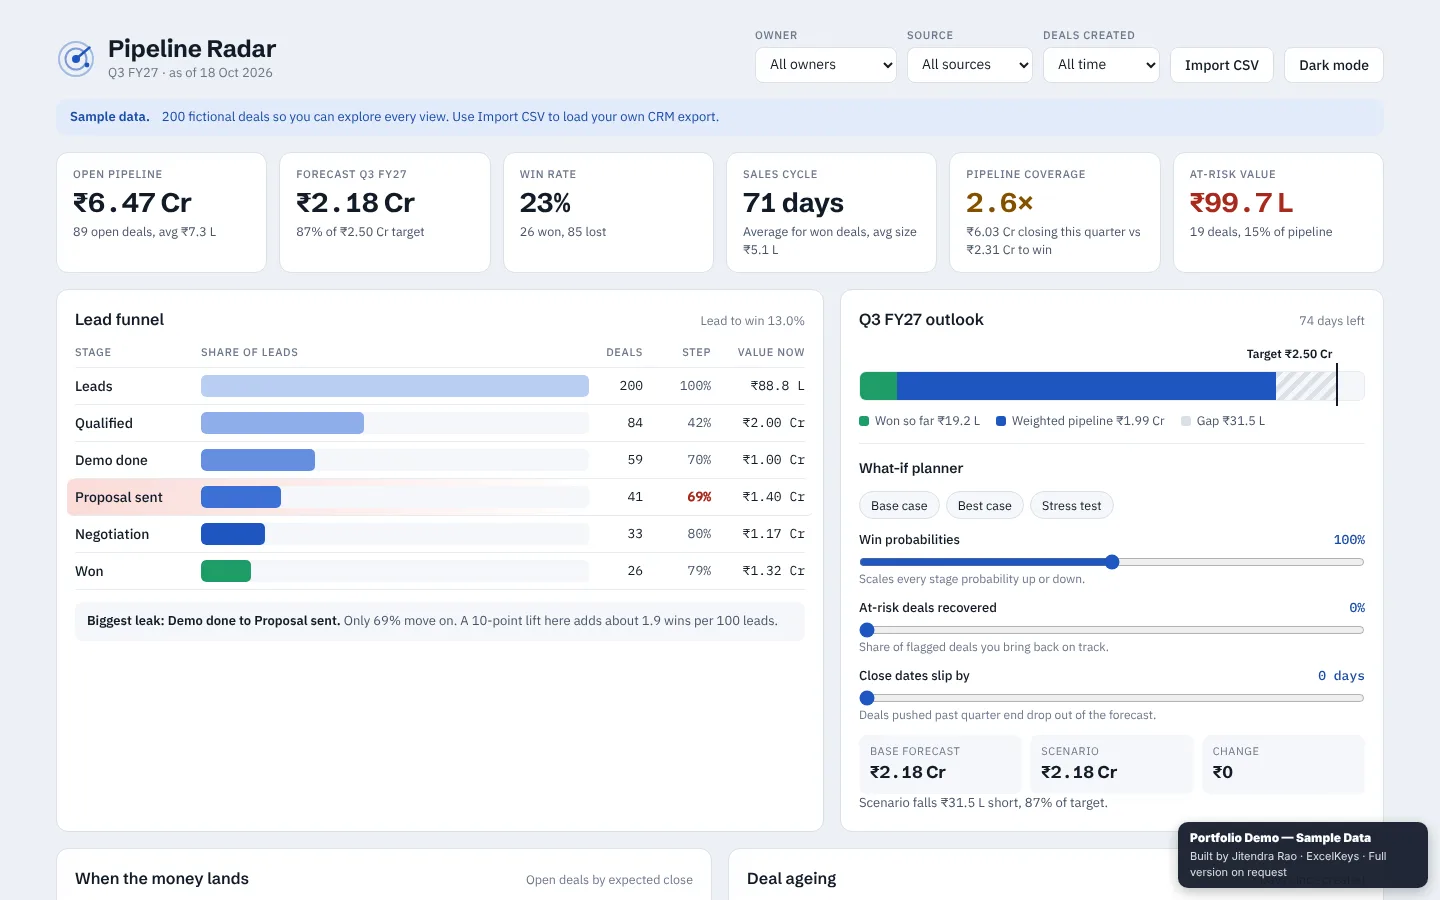
A forecasting dashboard that reads a CRM export in CSV format. Filter by owner, source and creation date, then test scenarios and pick the deals to chase. The forecast updates live as you move the levers.
Highlights
- Forecast against target, weighted by stage, with the pipeline coverage ratio.
- The biggest funnel leak in plain language, with the wins a 10-point lift at that stage would add.
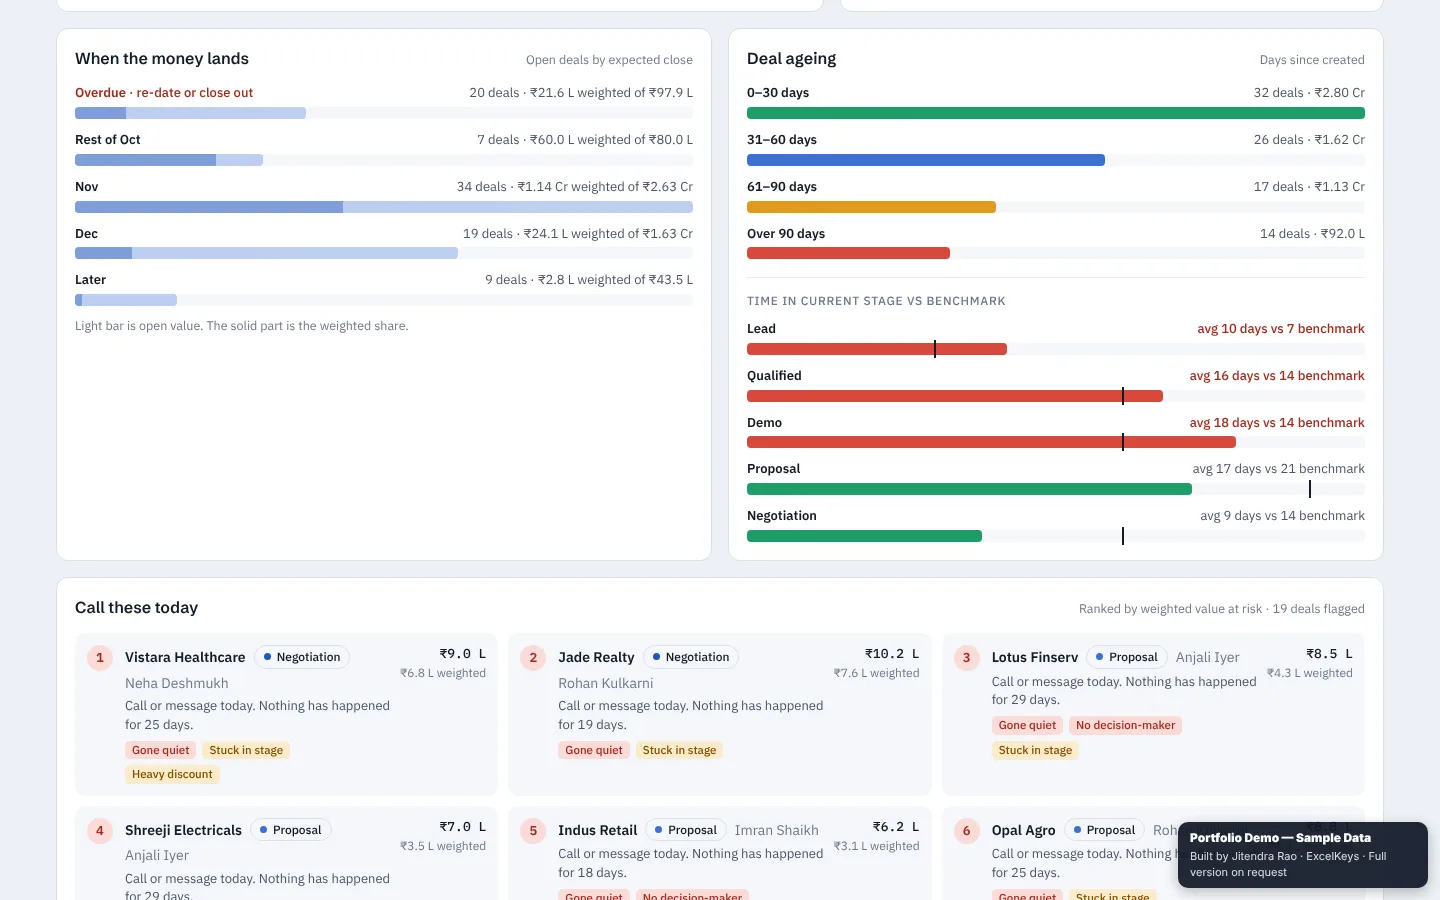
- At-risk value and a ranked “call these today” list with the reason each deal was flagged.
- A what-if planner for win probability, recovered at-risk deals and close-date slippage.
- Open and weighted value by expected close month, with overdue deals separated so they can be re-dated or closed.
Private by design
Your CRM export is read inside your browser and is never uploaded. The public demo runs on fictional sample data. You can filter, click through every view and even load your own file, while export, print and save are switched off in the demo. The full working version is built for your team on request.
Pipeline Radar: Sales Forecast Dashboard at a glance
- Built for
- Sales leaders, RevOps, founders, account managers and sales ops
- Replaces
- A big pipeline number and a forecast model rebuilt every week
- Input
- Your CRM export as a CSV file
- Output
- Six pipeline KPIs, funnel, quarter outlook, what-if planner and a call list
- Runs
- In the browser, your file is never uploaded
Who it is for
- Sales leaders who commit a quarter number to the business
- RevOps and sales ops teams who prepare the weekly pipeline review
- Founders who run sales themselves and need a quick forecast
- Account managers who want to know which deals need a call today
What it measures
| Metric | What it tells you |
|---|---|
| Open pipeline | Total value of deals that are still open |
| Quarter forecast | Stage-weighted value expected to close this quarter, against target |
| Win rate | Share of closed deals that were won |
| Sales cycle | Average days from deal creation to close |
| Pipeline coverage | Open pipeline divided by the target still to close |
| At-risk value | Weighted value of deals that are overdue or have gone quiet |
| Biggest funnel leak | The stage where the most deals are lost |
How it works
- ImportLoad your CRM export as a CSV file.
- FilterSlice by owner, source and creation date, in a light or dark theme.
- PlanTest base, best and stress cases with the what-if levers.
- ActWork through the "call these today" list.
Questions it answers
- What will the pipeline really close this quarter?
- Is our pipeline coverage enough for the target?
- At which funnel stage do we lose the most deals?
- Which deals have gone quiet and need a call today?
- What happens to the forecast if close dates slip?
Built around your team
The demo uses fictional sample data. For your team we rebuild it around your own file. Typical changes:
- Your CRM's own stage names and probabilities
- Your quarter, fiscal year and target
- Cuts by region, product, owner or source
- Your company name, logo and colours
Who built it
Designed and built by Jitendra Rao, founder of Excel Keys, who has more than 11 years of hands-on experience in MIS reporting, sales analytics and dashboard automation. Every screenshot and demo uses fictional sample data.
Last updated
Frequently asked questions
What is a sales pipeline forecast dashboard?
It reads the deals in your CRM, weights each one by its stage and expected close date, and shows what is likely to close this quarter against the target, together with the deals that put the number at risk.
What is pipeline coverage?
Pipeline coverage is open pipeline value divided by the target still to close in the period. A ratio of 3 means the pipeline is three times the remaining target.
Which CRMs does it work with?
Any CRM that can export deals to CSV. The demo uses 200 fictional deals; a custom build is mapped to the column names your CRM exports.
Is our data uploaded anywhere?
No. The dashboard is a single file that runs inside your browser. There is no server and no cloud upload, and it works without an internet connection once it is open. Your file never leaves your computer.
What is switched off in the public demo?
Export, print and save are disabled in the public preview, and the data shown is fictional. Filters, charts and file upload all work, so you can test it with your own file. The full working version is built for your team on request.
Does it work on a phone?
It is built for a laptop or desktop screen, where the tables and charts have room. Use Chrome, Edge or Firefox on a normal office computer.