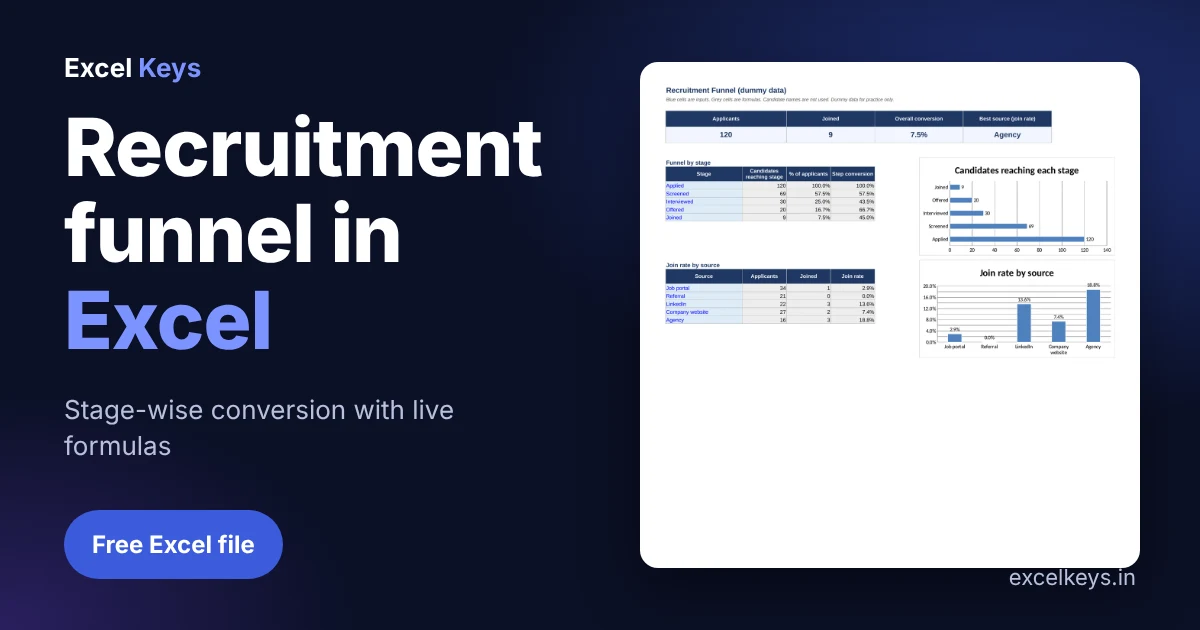
A recruitment funnel in Excel shows how many candidates reach each hiring stage and what share moves on to the next one. You need one row per candidate, a stage column, and COUNTIFS formulas. This guide builds the funnel step by step and includes a free template with dummy data.
Key takeaways
- A recruitment funnel counts candidates who reached each stage, then divides by the stage before it.
- Store one furthest-stage value per candidate and use COUNTIFS with a stage number. No pivot table needed.
- In the dummy data, 120 applicants lead to 9 joiners, an overall conversion of 7.5 percent.
- The weakest step is Screened to Interviewed at 43.5 percent. That is where to look first.
In this guide
- What a recruitment funnel tells you
- Step 1: Set up the candidate table
- Step 2: Turn stages into numbers
- Step 3: Count each stage with COUNTIFS
- Step 4: Add the source view
- Worked example: reading the funnel
- Download the free recruitment funnel template
- How to improve each stage
- Common mistakes
- Frequently asked questions
What a recruitment funnel tells you
A recruitment funnel in Excel turns a hiring list into a picture of where candidates drop out. A low screening rate points to weak job ads or the wrong sourcing channel. A low offer-to-join rate points to pay, brand or speed. The funnel is one of the core views in a talent acquisition dashboard.
Step 1: Set up the candidate table
Use one row per candidate with an ID instead of a name, so the file stays safe to share. Columns: Candidate ID, Role, Source and Furthest stage reached. Make the stage a drop-down with data validation so every entry matches a stage name exactly.
| Candidate ID | Role | Source | Furthest stage reached |
|---|---|---|---|
| C-2001 | Developer | Screened | |
| C-2002 | Analyst | Offered | |
| C-2003 | Developer | Agency | Joined |
Step 2: Turn stages into numbers
Candidates who joined also passed screening and interview, so they must be counted at every earlier stage. Convert each stage name to its position in the list (Applied is 1, Joined is 5) and count everyone at or above a position.
Stage no. (Data!E2):
=IFERROR(MATCH(D2,Dashboard!$A$10:$A$14,0),"")
Step 3: Count each stage with COUNTIFS
The COUNTIFS function counts rows that meet a condition. Here the condition is a stage number greater than or equal to the stage in the row:
Candidates reaching the stage in A10:
=COUNTIFS(Data!$E$2:$E$500, ">="&MATCH($A10,$A$10:$A$14,0))

% of applicants:
=IFERROR(B10/B$10, 0)

Step conversion (row 11 onward):
=IFERROR(B11/B10, 0)
Step 4: Add the source view
Overall conversion hides which channel works. Count applicants and joiners per source and divide:
Applicants:  =COUNTIFS(Data!$C$2:$C$500,$A22)
Joined:      =COUNTIFS(Data!$C$2:$C$500,$A22,Data!$D$2:$D$500,"Joined")
Join rate:   =IFERROR(C22/B22,0)
Worked example: reading the funnel
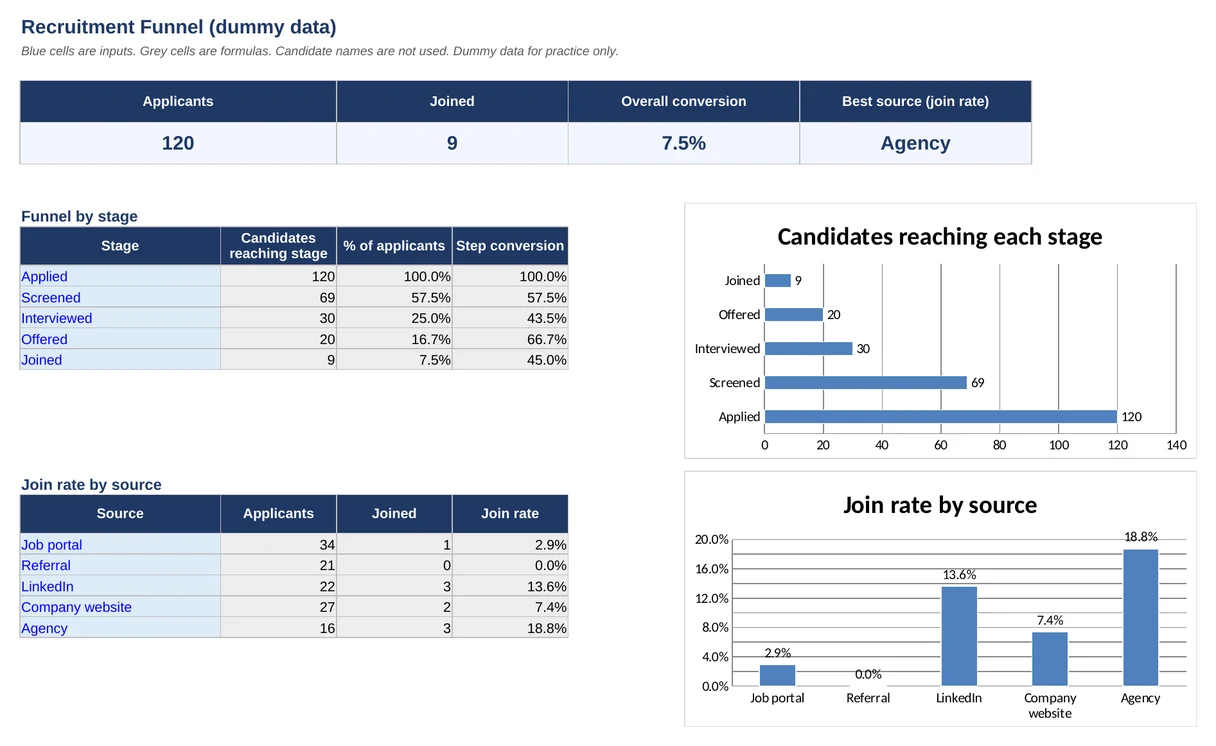
| Stage | Candidates | % of applicants | Step conversion |
|---|---|---|---|
| Applied | 120 | 100.0% | 100.0% |
| Screened | 69 | 57.5% | 57.5% |
| Interviewed | 30 | 25.0% | 43.5% |
| Offered | 20 | 16.7% | 66.7% |
| Joined | 9 | 7.5% | 45.0% |
Of 120 applicants, 69 were screened, 30 interviewed, 20 received offers and 9 joined. The weakest step is Screened to Interviewed, at 43.5 percent.
By source, Agency has the best join rate at 18.8 percent (3 of 16), and Referral the lowest at 0.0 percent. Small samples swing wildly, so judge a source only after you have 30 or more candidates from it.
Download the free recruitment funnel template
To see the recruitment funnel in Excel working end to end, download the file. The workbook has the Data sheet with drop-downs, a Dashboard with funnel, conversion and source tables and charts, and a How to use sheet. No macros.
How to improve each stage
- Applied to screened: rewrite the job post with the real salary band and must-have skills.
- Screened to interviewed: shorten the gap between screening and the first call.
- Interviewed to offered: align hiring managers on a scorecard before interviews start.
- Offered to joined: speed up the offer, and track the reasons for declines.
Speed matters at every step. Measure it with the time to hire formula and the price of each hire with the cost per hire formula.
Common mistakes
Most errors in a recruitment funnel in Excel come from the data, not the formulas.
- Counting only people at a stage today, instead of everyone who reached it.
- Free-typed stage names, so ‘Interviewed’ and ‘Interview’ split the count.
- Comparing sources with tiny samples.
- Funnels without a period. Always filter to a hiring cycle.
Need this on a live dashboard with filters by role and recruiter? We build them on your own Excel file. See the HR Analytics Dashboard or contact us.
Frequently asked questions
What is a recruitment funnel?
A recruitment funnel is a view of how candidates move through hiring stages such as applied, screened, interviewed, offered and joined. It shows how many people reach each stage and what share moves on, so you can see where candidates drop out.
How do I calculate recruitment funnel conversion rate?
Divide the number of candidates who reached a stage by the number who reached the stage before it. For overall conversion, divide joiners by applicants. In Excel, use COUNTIFS to count each stage and IFERROR to avoid divide-by-zero errors.
Why must I count candidates at every earlier stage?
A candidate who joined also passed screening, interview and offer. If you count only the current stage, earlier stages look too small and the conversion rates become wrong. Storing a stage number and counting greater-or-equal fixes it.
What is a good offer to joining ratio?
It varies by role, notice period and market, so compare against your own history. A falling ratio usually points to slow offers, pay gaps or competing offers. Track the reasons for declines to see which one applies.
Can I build a recruitment funnel without a pivot table?
Yes. A stage number column and COUNTIFS formulas give the same counts, and the file updates when you add rows. Pivot tables are fine for exploration, but formulas keep layout and conversion rates fixed on the dashboard.
About the author: Jitendra Rao is the founder of Excel Keys and has spent over 11 years building MIS reports, sales analytics and dashboard automation for banking and finance teams. He builds Excel dashboards that run offline, on your own files. Last updated: 19 November 2026.