The cost per hire formula is simple: add your internal recruiting costs and your external recruiting costs for a period, then divide by the number of hires in that period. This guide shows the formula, a worked example with real arithmetic, and a free Excel calculator that does it for you.
Key takeaways
- Cost per hire = (internal costs + external costs) / number of hires in the same period.
- Internal costs are recruiter time, tools and branding. External costs are agency fees, job portals, referral bonuses and travel.
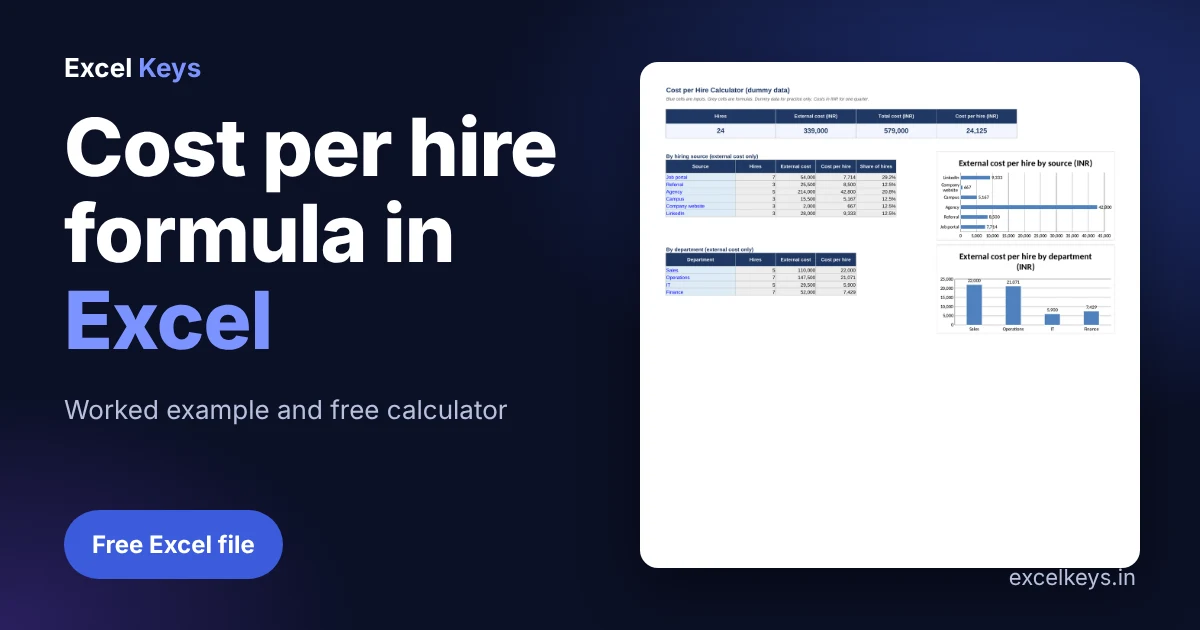
- In the free calculator, 24 dummy hires cost Rs 579,000 in total, so cost per hire is Rs 24,125.
- Track cost by source. Agency is the most expensive channel in the example and Company website the cheapest.
In this guide
- The cost per hire formula
- What counts as internal and external cost
- Worked example with real numbers
- Build the calculator in Excel
- Reading the result by source
- Download the free cost per hire calculator
- Common mistakes
- Put it on a dashboard
- Frequently asked questions
The cost per hire formula
The widely used version of the cost per hire formula comes from SHRM and the ANSI standard on cost per hire. It counts every rupee spent to fill positions, then divides by hires:
Cost per hire = (Total internal recruiting costs + Total external recruiting costs) / Total number of hiresUse one period for both sides, such as a quarter or a financial year, and count only hires who actually joined.
What counts as internal and external cost
| Internal costs | External costs |
|---|---|
| Recruiter and HR salary for hiring time | Agency and search fees |
| Recruiting software and subscriptions | Job portal and advertising spend |
| Employer branding and career events | Referral bonuses |
| Hiring manager interview time (optional) | Assessment tests, background checks, travel |
If you also track speed, pair this metric with the time to hire formula. Together they show how quickly and at what price you fill roles.
Worked example with real numbers
A team hires 24 people in one quarter. The numbers below are dummy data from the free calculator.
| Item | Amount (Rs) |
|---|---|
| Recruiter salary share | 1,80,000 |
| Recruiting tools | 36,000 |
| Employer branding | 24,000 |
| Internal costs | 240,000 |
| External costs (agency, portals, referral, other) | 339,000 |
| Total cost | 579,000 |
| Hires | 24 |
Cost per hire = 579,000 / 24 = Rs 24,125. External cost alone is Rs 339,000, which is Rs 14,125 per hire.
Build the calculator in Excel
- Create a Settings sheet with three input cells for internal costs.
- On a Data sheet, add one row per hire with source, department and each external cost. Add a total column with
=SUM(D2:G2). - Add Source as a drop-down using data validation so spelling stays consistent.
- On the Dashboard, count hires and total cost, then divide with a safe formula.
Hires:            =COUNTA(Data!$A$2:$A$500)
External cost:    =SUM(Data!$H$2:$H$500)
Total cost:       =C5+SUM(Settings!$B$2:$B$4)
Cost per hire:    =IFERROR(E5/A5,0)

By source (A10 = source name):
Hires:            =COUNTIFS(Data!$C$2:$C$500,$A10)
External cost:    =SUMIFS(Data!$H$2:$H$500,Data!$C$2:$C$500,$A10)
Cost per hire:    =IFERROR(C10/B10,0)
The COUNTIFS and SUMIFS functions do the grouping, and IFERROR avoids a divide-by-zero when a source has no hires.
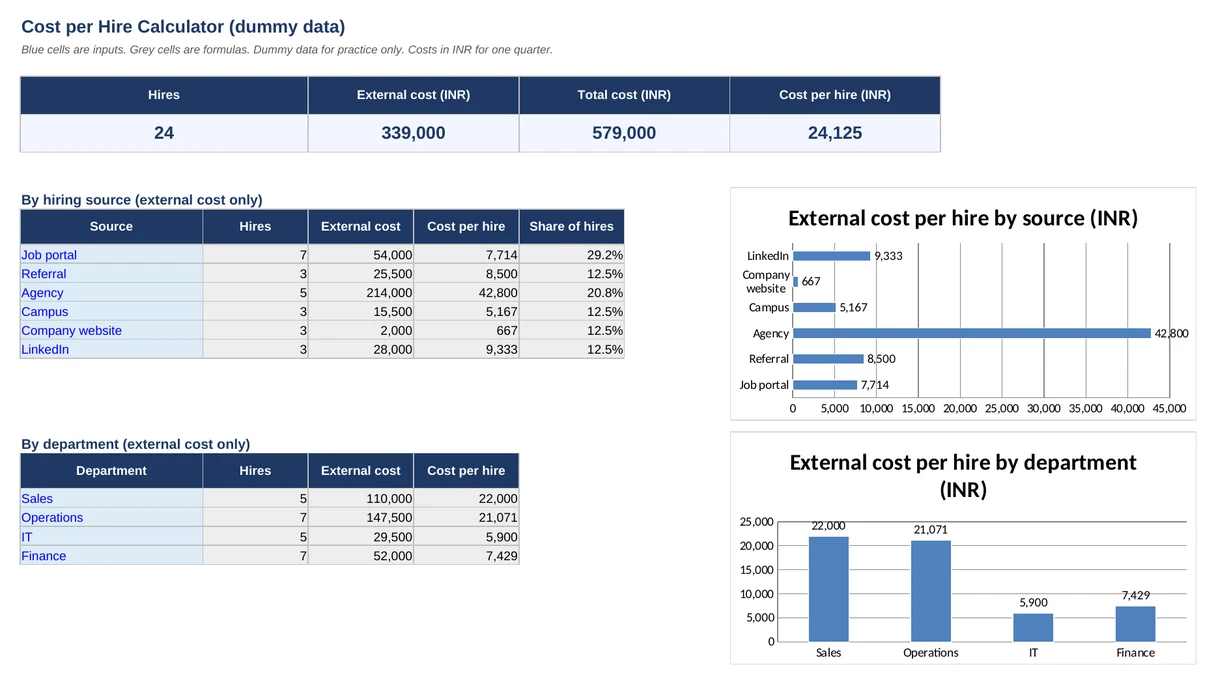
Reading the result by source
| Source | Hires | External cost (Rs) | Cost per hire (Rs) |
|---|---|---|---|
| Job portal | 7 | 54,000 | 7,714 |
| Referral | 3 | 25,500 | 8,500 |
| Agency | 5 | 214,000 | 42,800 |
| Campus | 3 | 15,500 | 5,167 |
| Company website | 3 | 2,000 | 667 |
| 3 | 28,000 | 9,333 |
Agency costs Rs 42,800 per hire in external spend, against Rs 667 for Company website. That gap is the reason to track the metric by source. Move budget toward cheaper channels that still bring quality hires, and check quality with your own retention data.
Download the free cost per hire calculator
The workbook has the Settings, Data and Dashboard sheets with live formulas, a drop-down for source and a How to use sheet. No macros are used.
Common mistakes
- Counting offers made instead of hires who joined.
- Leaving out internal costs, which makes agencies look cheaper than they are.
- Mixing periods, for example a full year of costs with one quarter of hires.
- Reading one blended number. Always split by source and role level.
- Judging cost alone. Pair it with quality of hire and the first-year attrition from your HR dashboard in Excel.
Put it on a dashboard
Cost per hire is one of the 12 metrics in our guide to talent acquisition dashboard KPIs. If you want it in a live view with filters, we can build it into a HR Analytics Dashboard on your own file. Send us your sheet for a quote.
Frequently asked questions
What is the cost per hire formula?
Cost per hire equals total internal recruiting costs plus total external recruiting costs, divided by the number of hires in the same period. Internal costs include recruiter time and tools. External costs include agency fees, job portals, referral bonuses and travel for interviews.
How do I calculate cost per hire in Excel?
List external costs per hire on one sheet, enter internal costs as inputs, sum everything, and divide by the count of hires with an IFERROR wrapper. Use SUMIFS and COUNTIFS to see the figure by source. The free calculator above has all formulas ready.
What is a good cost per hire in India?
It depends on role level, industry and city, so any single number would mislead. Compare your figure against your own previous quarters and against channels inside the company. Entry roles filled by referral usually cost far less than senior hires through agencies.
Should salary of the recruiter be included in cost per hire?
Yes, include the share of recruiter and HR salary spent on hiring, because it is a real internal cost. Without it, in-house hiring looks free. Estimate the share from time spent and keep the same method every period.
How is cost per hire different from cost per application?
Cost per hire divides total spend by candidates who joined, while cost per application divides ad or portal spend by applications received. Cost per application tells you about reach. Cost per hire tells you about the real price of filling a seat.
About the author: Jitendra Rao is the founder of Excel Keys and has spent over 11 years building MIS reports, sales analytics and dashboard automation for banking and finance teams. He builds Excel dashboards that run offline, on your own files. Last updated: 15 November 2026.