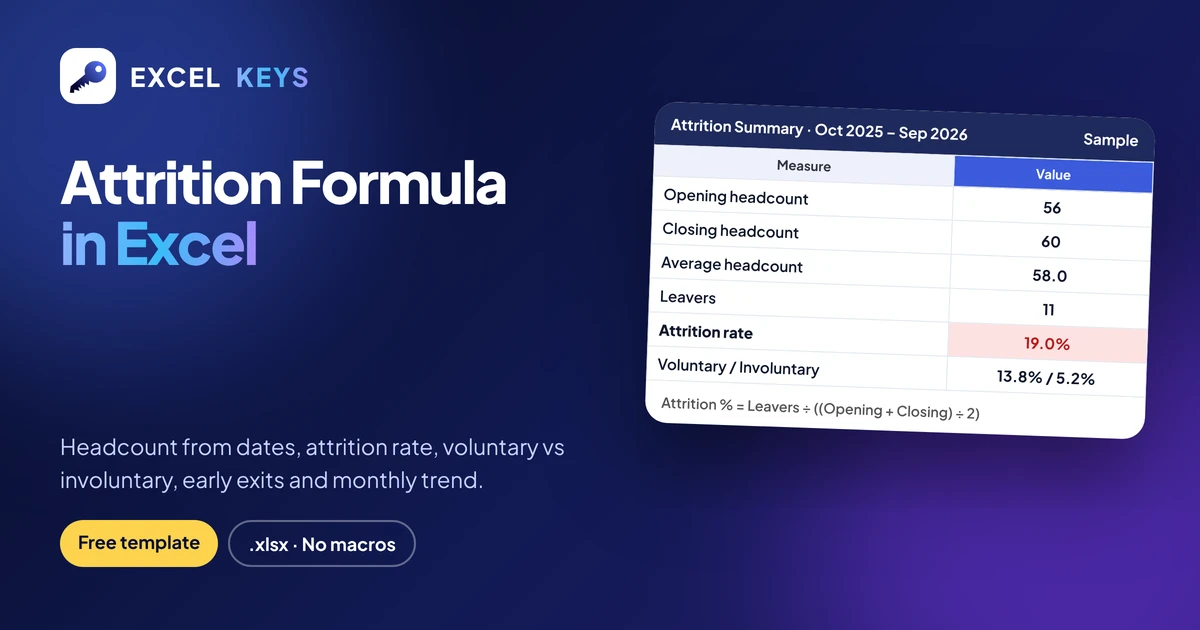
The attrition formula in Excel is: attrition rate = number of leavers in the period ÷ average headcount, where average headcount = (opening headcount + closing headcount) ÷ 2. Count leavers with COUNTIFS on the exit date, count headcount from join and exit dates, then divide. With 11 leavers and headcount moving from 56 to 60, attrition is 11 ÷ 58 = 19.0%.
Attrition is the HR number management asks about most, and also the one most often calculated in different ways by different people. This guide shows the standard method step by step, builds every count with formulas from a simple employee list, separates voluntary from involuntary exits, flags early exits, and explains the annualising mistake that can turn a 19% year into a 59% headline. The finished calculator is a free download with 72 dummy employees.
Key takeaways
- Attrition rate = leavers in the period ÷ average headcount. Use the average of opening and closing headcount, not one of them.
- Keep one employee list with join date, exit date and exit type. Every headcount and leaver count then comes from COUNTIFS, so nothing is typed by hand.
- Split attrition into voluntary and involuntary. In the sample, 19.0% overall is 13.8% voluntary and 5.2% involuntary.
- Never multiply one month by 12 and call it annual attrition. In the sample, July alone × 12 gives 59.0% while the real 12-month figure is 19.0%.
- Look at departments and early exits too: Operations runs at 35.3%, and 2 of the 15 joiners left within 90 days.
In this guide
- The attrition rate formula
- Step 1: Prepare the employee list
- Step 2: Headcount and leavers with COUNTIFS
- Step 3: Voluntary, involuntary and early exits
- Step 4: Monthly attrition and the annualising trap
- Free attrition calculator template
- Frequently asked questions
The attrition rate formula
Average headcount = (Opening headcount + Closing headcount) / 2
Attrition rate    = Leavers in the period / Average headcount
Opening headcount is the number of employees on the roll on the first day of the period. Closing headcount is the number on the last day. Leavers are the employees whose last working day falls inside the period. The period can be a month, a quarter or a year. For an Indian financial year, it runs from 1 April to 31 March.
Why the average, not opening or closing alone? Headcount moves during the year as people join and leave. In the sample, the same 11 leavers give 19.6% if you divide by the opening 56, 18.3% if you divide by the closing 60, and 19.0% with the average of 58. The average is the fair middle, and it is the method most HR teams and HR software use, so your number stays comparable with others.
Attrition is often used to mean the same as employee turnover. Some companies keep “turnover” for all exits and “attrition” for roles that are not refilled. Whichever word your company uses, write the definition once and use it every month.
Step 1: Prepare the employee list
Everything comes from one sheet called Employees with one row per person:
| Column | What to enter |
|---|---|
| Emp ID, Name, Department | From your HR system |
| Join date | A real Excel date |
| Exit date | Last working day; leave blank for active employees |
| Exit type | Voluntary or Involuntary (drop-down) |
| Tenure at exit (days) | Formula: =IF(E2=””,””,E2-D2) |
Include everyone who was on the roll at any time in the period, plus people who left earlier if that is easier. The formulas ignore anyone outside the dates you choose. In the sample list, one employee left in August 2025, before the period starts, and is correctly left out of every count. Clean dates matter more than anything else here; the checklist for preparing Excel data covers the common problems, such as dates stored as text.
Step 2: Headcount and leavers with COUNTIFS
Put the period start in C2 and the period end in C3 of the summary sheet. Then four COUNTIFS formulas do all the counting. Here, Join is the join-date column, Exit the exit-date column, Start is $C$2 and End is $C$3:
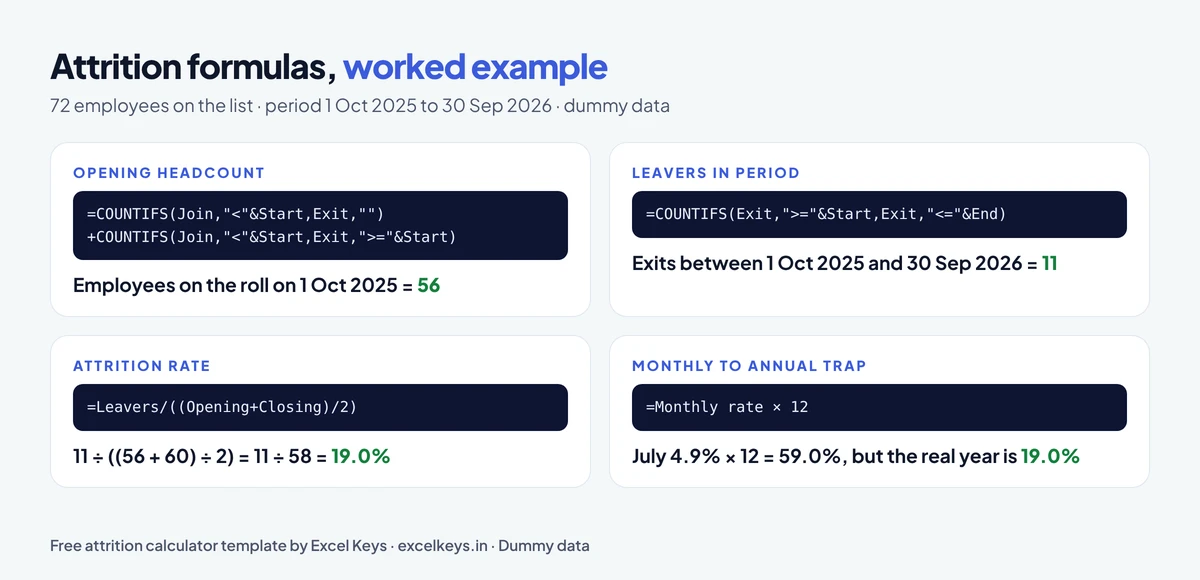
Opening headcount = COUNTIFS(Join,"<"&Start, Exit,"")
                  + COUNTIFS(Join,"<"&Start, Exit,">="&Start)

Closing headcount = COUNTIFS(Join,"<="&End, Exit,"")
                  + COUNTIFS(Join,"<="&End, Exit,">"&End)

Joiners           = COUNTIFS(Join,">="&Start, Join,"<="&End)
Leavers           = COUNTIFS(Exit,">="&Start, Exit,"<="&End)

Attrition rate    = IFERROR(Leavers / ((Opening + Closing)/2), 0)
Each headcount formula has two parts. The first counts people who joined in time and have no exit date. The second counts people who joined in time and left later. Together they give everyone on the roll on that day. An employee whose last working day is 30 September is counted as a leaver of September and is not in the closing headcount for 30 September, so no one is counted twice.
Worked example
The sample covers the 12 months from 1 October 2025 to 30 September 2026 (all names and dates are fictional):
| Measure | Result |
|---|---|
| Opening headcount (1 Oct 2025) | 56 |
| Joiners in the period | 15 |
| Leavers in the period | 11 |
| Closing headcount (30 Sep 2026) | 60 |
| Average headcount | (56 + 60) ÷ 2 = 58 |
| Attrition rate | 11 ÷ 58 = 19.0% |
Always run that last check. Opening + joiners − leavers should equal closing. If it does not, some dates are missing or typed as text.
Step 3: Voluntary, involuntary and early exits
A single attrition number hides the story. Add the exit type and tenure as extra conditions:
Voluntary leavers   = COUNTIFS(Exit,">="&Start, Exit,"<="&End, Type,"Voluntary")
Involuntary leavers = COUNTIFS(Exit,">="&Start, Exit,"<="&End, Type,"Involuntary")
Early exits         = COUNTIFS(Exit,">="&Start, Exit,"<="&End, Tenure,"<="&90)

Voluntary attrition = Voluntary leavers / Average headcount- Voluntary attrition (resignations): 8 ÷ 58 = 13.8%. This is the part that better hiring, pay and managers can change.
- Involuntary attrition (terminations, absconding, contract end): 3 ÷ 58 = 5.2%.
- Early exits: 2 people left within 90 days of joining, after 24 and 49 days. That is 2 of 15 joiners, or 13.3%. Early exits usually point to a hiring or onboarding problem rather than a pay problem.
The same pattern, with Department added as a condition, gives attrition by department:
| Department | Average headcount | Leavers | Attrition % |
|---|---|---|---|
| Sales | 24.0 | 4 | 16.7% |
| Operations | 17.0 | 6 | 35.3% |
| Finance | 9.0 | 1 | 11.1% |
| HR | 8.0 | 0 | 0.0% |
| Total | 58.0 | 11 | 19.0% |
With small teams, read percentages with care. Finance shows 11.1% from a single exit; one more resignation would double it. For teams under about 20 people, report the number of leavers next to the percentage.
Step 4: Monthly attrition and the annualising trap
For a month-by-month view, use the same formulas with the first and last day of each month. In the template, the month start comes from =EDATE($C$2, n) and the month end from =EOMONTH(month start, 0), so the table rebuilds itself when you change the period.
Here is the trap. July 2026 in the sample has 3 leavers on an average headcount of 61, a monthly rate of 4.9%. Multiply that by 12 and you get 59.0%. The real attrition for the 12 months is 19.0%. A single bad month, multiplied by 12, can cause real panic in a management meeting.
- For a full year, use the 12-month formula directly. No annualising is needed.
- For part of a year, annualise the period figure, not one month: annualised = period attrition × 12 ÷ months in the period. For example, 9% in the first six months is about 18% a year.
- For a trend, show monthly rates side by side, or a rolling 12-month figure that recalculates every month.
Adding the 12 monthly rates gives 18.2% in the sample, close to the 19.0% annual figure but not the same, because each month uses its own average headcount. Use the direct 12-month formula for the official number.
Free attrition calculator template (download)
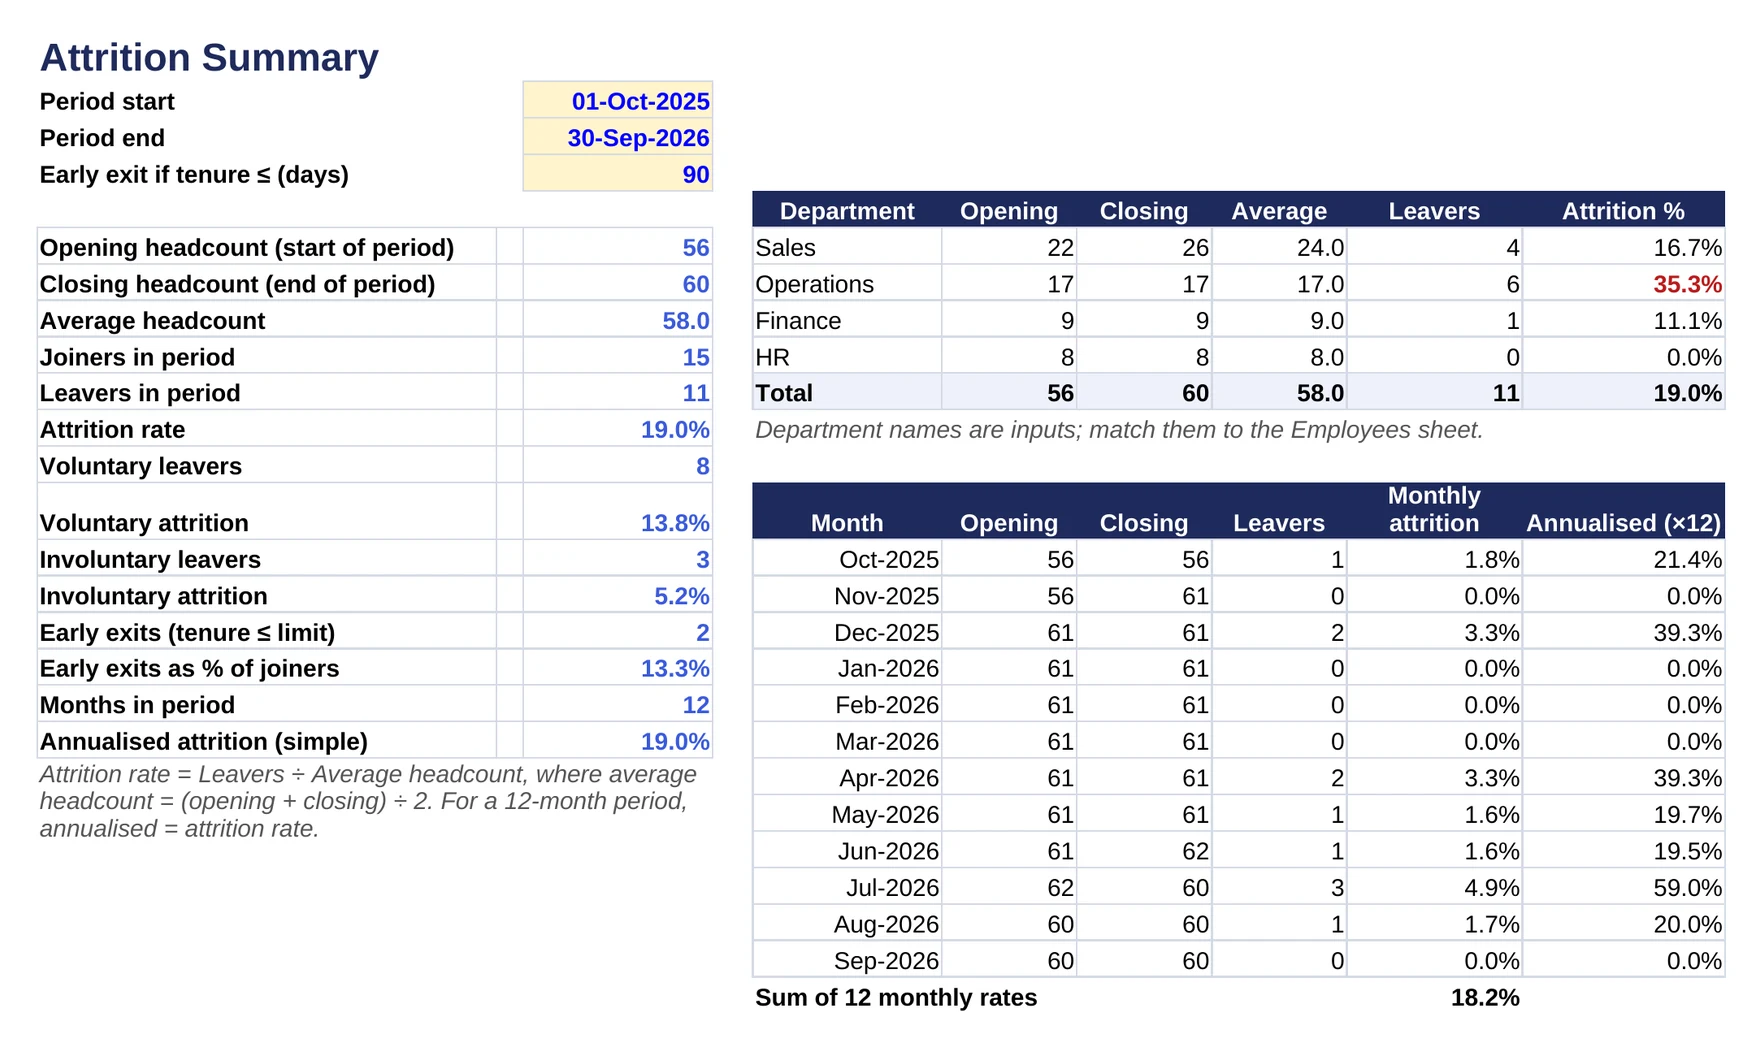
The workbook has three sheets:
- How to use: five steps and every formula in plain words.
- Attrition Summary: period start, period end and the early-exit limit as inputs; 14 headline measures; a department table that turns red above the company rate; and a 12-month table with monthly and annualised rates.
- Employees: 72 dummy employees with join and exit dates, a drop-down for exit type and a tenure formula. Formulas read up to row 1,000.
It uses only COUNTIFS, EDATE, EOMONTH and IFERROR, with no macros, so it works in Excel 2010 and later, Excel for the web and Google Sheets.
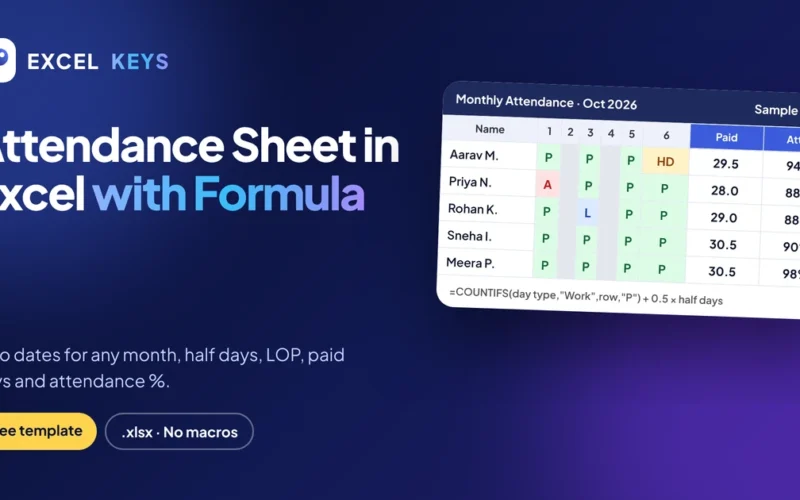
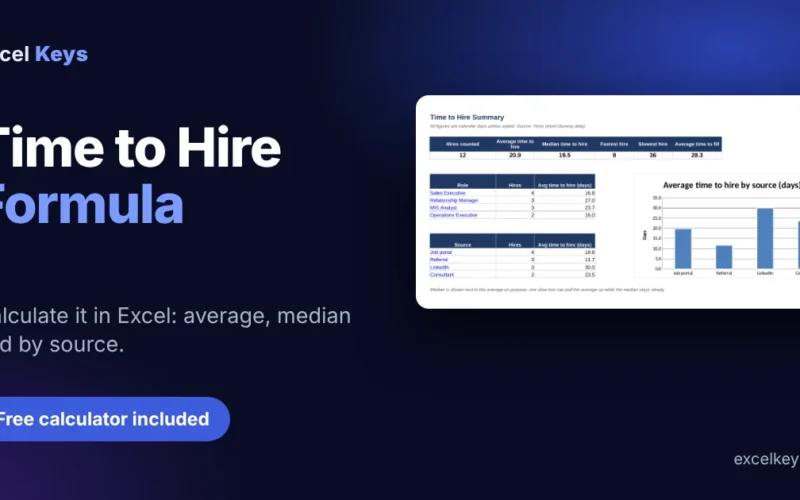
To use it: paste your employee list over the dummy rows, set the period (for example 01-Apr-2026 to 31-Mar-2027 for a financial year) and read the summary. More free workbooks, including the attendance sheet and the time to hire calculator, are on our free Excel templates page.
Common mistakes when calculating attrition
- Dividing by closing headcount only. In a growing team this understates attrition; in a shrinking team it overstates it.
- Annualising one month. Monthly × 12 exaggerates every bad month. Annualise a period, or use 12 months of data.
- Counting the resignation date instead of the last working day. Pick one date rule and use it every month, or leavers move between months.
- Typing headcount by hand. Calculate it from join and exit dates so opening + joiners − leavers always equals closing.
- Showing only the total. Split by voluntary and involuntary, department and tenure. That is where the action points are.
From attrition to a complete HR report
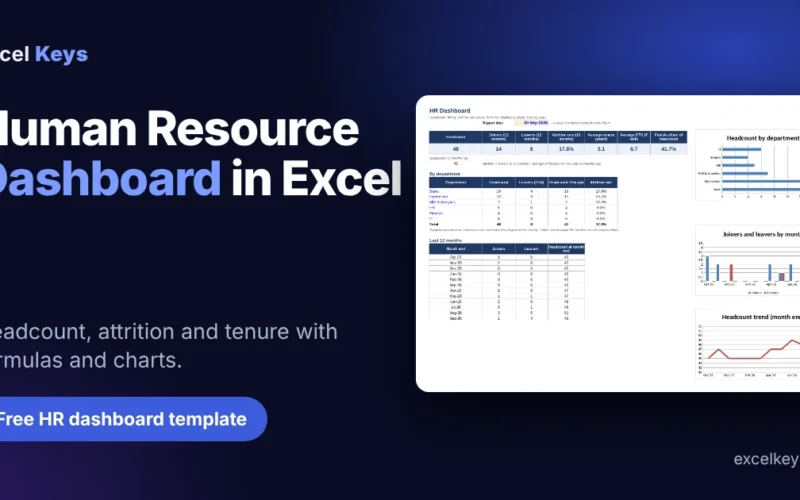
Attrition sits next to headcount, hiring and attendance in a monthly HR review. Our guide to the human resource dashboard in Excel brings headcount, attrition and tenure onto one page, and the 12 talent acquisition dashboard KPIs cover the hiring side that replaces the people who leave.
If you report attrition across many locations, grades and managers every month, a dashboard saves the most time. You can try our HR analytics dashboard and the HR Insight Analyzer live in your browser on sample data.
Frequently asked questions
What is the formula for attrition rate in Excel?
Attrition rate = leavers ÷ average headcount, where average headcount = (opening + closing) ÷ 2. In Excel: =IFERROR(C10/((C6+C7)/2),0), with leavers in C10 and opening and closing headcount in C6 and C7. Format the cell as a percentage.
How do I calculate monthly attrition in Excel?
Use the same formula with the first and last day of the month: count leavers whose exit date falls in the month with COUNTIFS, count headcount on the first and last day, and divide leavers by the average. For example, 3 leavers with headcount 62 at the start and 60 at the end gives 3 ÷ 61 = 4.9%.
How do I calculate annual attrition from monthly attrition?
The most reliable way is to calculate attrition directly for the full 12 months: leavers in the year ÷ average headcount for the year. If you have only part of a year, annualise the period figure: period attrition × 12 ÷ months in the period. Do not multiply a single month by 12.
What is the difference between voluntary and involuntary attrition?
Voluntary attrition counts employees who chose to leave, such as resignations. Involuntary attrition counts exits decided by the company, such as terminations or contract ends. Both use average headcount as the denominator, so together they add up to the total attrition rate.
How do I count headcount on a date in Excel?
Count employees who joined before the date and have either no exit date or an exit date on or after it: =COUNTIFS(Join,”<“&D,Exit,””)+COUNTIFS(Join,”<“&D,Exit,”>=”&D), with the date in cell D. This works for any date, so the same formula gives opening and closing headcount.
What is a good attrition rate?
It depends heavily on the industry, role and city. Frontline sales and operations roles usually see much higher attrition than finance or technology roles. The most useful comparison is your own trend and your own departments: track the same formula every month and act on the teams that are rising.
One formula, used the same way every month
Attrition only becomes useful when it is calculated the same way every time. Use leavers ÷ average headcount, keep the employee list clean, and look beyond the total. Download the calculator and set your period to start. If you want attrition, headcount and hiring in one live HR dashboard built around your own data, send us your requirement.