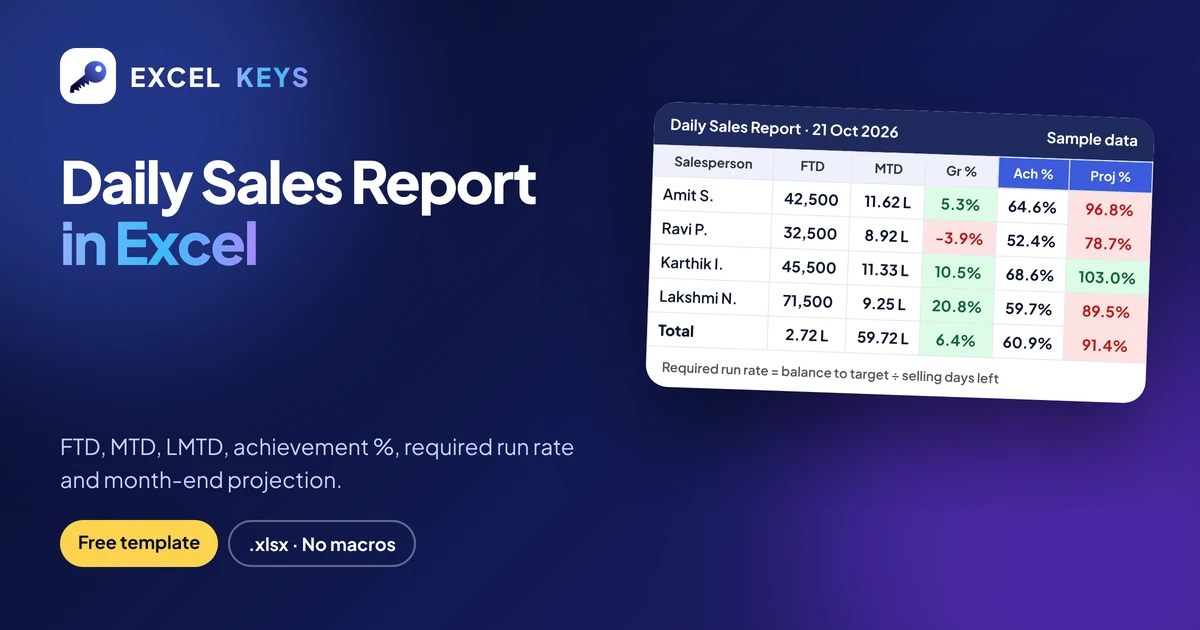
A daily sales report in Excel shows, for one report date, each salesperson’s sales for the day (FTD), month to date (MTD), last month to date (LMTD), achievement against target and the run rate needed to close the gap. Build it with SUMIFS on a daily data sheet, and change one date cell to refresh the whole report every morning.
Most daily sales report templates online are just blank tables where you type the totals yourself. A sales manager needs more than totals: the answer to “will we hit the target this month, and who needs help?” This guide builds that report step by step with formulas that work in any Excel version, and gives you the finished workbook as a free download, with two months of sample data for six salespeople.
Key takeaways
- Keep raw sales in one Data sheet, one row per sale or per salesperson per day. Never type totals into the report.
- FTD, MTD and LMTD are all one SUMIFS formula with different date limits. A single report-date cell drives every figure.
- Required run rate = balance to target ÷ selling days left. Projected month-end = MTD ÷ selling days gone × selling days in the month.
- Count selling days correctly. If your team does not sell on Sundays, use NETWORKDAYS.INTL with weekend code 11, or the projection will be too low.
- In the sample report for 21 October 2026, the team is at 60.9% of target with 9 selling days left, and is projected to finish at 91.4% unless the daily run rate rises from ₹3,31,778 to ₹4,25,333.
In this guide
- Daily sales report format: what to include
- Step 1: Set up the data and targets
- Step 2: FTD, MTD and LMTD formulas
- Step 3: Achievement, run rate and projection
- Worked example with real numbers
- Free daily sales report template
- Frequently asked questions
Daily sales report format: what to include
A daily sales report is read in two minutes, usually first thing in the morning. It should answer four questions in this order: what did we sell yesterday, where do we stand this month, are we ahead of last month, and what do we need per day to reach the target. That gives a standard column set used by sales and MIS teams across banking, insurance, retail and distribution:
| Column | Meaning |
|---|---|
| FTD | For the day: sales on the report date |
| MTD | Month to date: from the 1st of the month to the report date |
| LMTD | Last month to date: from the 1st of last month to the same day last month |
| Growth % | MTD compared with LMTD |
| Target and achievement % | Monthly target and MTD as a share of it |
| Balance to target | What is still needed this month |
| Current run rate | Average sales per selling day so far |
| Required run rate | Sales needed per selling day from now on |
| Projected month-end | Where the month will land at the current pace |
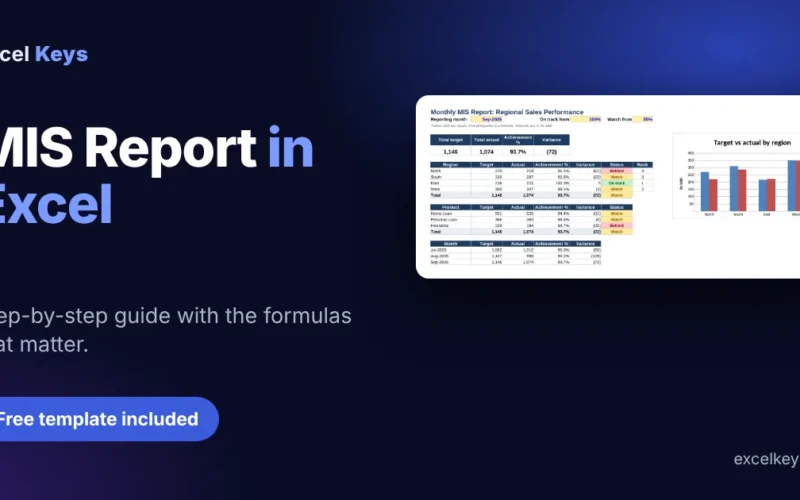
Under the main table, add a region summary, a product mix and a daily trend chart. Those three views explain why the totals moved. If this report is part of a larger monthly pack, see our step-by-step guide to the MIS report in Excel, which uses the same data-sheet approach.
Step 1: Set up the data and targets
Create a Data sheet with six columns: Date, Salesperson, Region, Product, Units and Amount (₹). Paste your system export here every day, one row per sale or one row per salesperson per day. Keep real Excel dates in column A, not text, and spell each name the same way every time. The checklist for preparing Excel data covers the rules that stop SUMIFS from silently missing rows.
Then create a Targets sheet with Salesperson, Region and Monthly target. On the report sheet, the target comes in with a lookup:
Monthly target (G6) = INDEX(Targets!$C$2:$C$50, MATCH(A6, Targets!$A$2:$A$50, 0))Finally, add the inputs at the top of the Daily Report sheet: the report date in C2 and a drop-down in C3 for the run-rate basis (Working days with Sunday off, or Calendar days). From the report date, four helper cells do the date maths:
Month start          G2 = EOMONTH(C2,-1)+1
Days in month        G3 = DAY(EOMONTH(C2,0))
Last month start     O2 = EOMONTH(C2,-2)+1
Same day last month  O3 = EDATE(C2,-1)
EDATE handles short months safely: for a report date of 31 March, the same day last month becomes 28 or 29 February instead of an error.
Step 2: FTD, MTD and LMTD formulas in Excel
All three are the same SUMIFS pattern: add up the Amount column where the salesperson matches and the date falls inside a window. Only the window changes.
FTD  (C6) = SUMIFS(Amount, Salesperson, A6, Date, $C$2)

MTD  (D6) = SUMIFS(Amount, Salesperson, A6,
                   Date, ">="&$G$2, Date, "<="&$C$2)

LMTD (E6) = SUMIFS(Amount, Salesperson, A6,
                   Date, ">="&$O$2, Date, "<="&$O$3)

Growth % (F6) = IFERROR(D6/E6-1, 0)
In the template, Amount is Data!$F$2:$F$5000, Salesperson is Data!$B$2:$B$5000 and Date is Data!$A$2:$A$5000, so you can keep adding rows for months without editing a formula. Two details matter:
- The ampersand joins the operator to the date.
">="&$G$2becomes “greater than or equal to 1 October 2026”. Typing the date inside the quotes would freeze it. - LMTD stops at the same day last month. Comparing 21 days of October with the full 30 days of September would make every month look like a decline.
For the region table, swap the Salesperson criterion for Region. For the product mix, swap it for Product and divide each product’s MTD by the total MTD to get its share.
Step 3: Achievement, required run rate and month-end projection
First count selling days. If the team works every day, calendar days are fine. If Sundays are off, count only working days with NETWORKDAYS.INTL and weekend code 11 (Sunday only):
Selling days elapsed  K2 = IF($C$3="Calendar days", DAY(C2),
                            NETWORKDAYS.INTL(G2, C2, 11))
Selling days in month Q2 = IF($C$3="Calendar days", G3,
                            NETWORKDAYS.INTL(G2, EOMONTH(C2,0), 11))
Selling days left     K3 = Q2 - K2
Then the five planning columns:
Achievement %        H6 = IFERROR(D6/G6, 0)
Balance to target    I6 = MAX(G6-D6, 0)
Current run rate     J6 = IFERROR(D6/$K$2, 0)
Required run rate    K6 = IFERROR(I6/$K$3, 0)
Projected month-end  L6 = IFERROR(D6/$K$2*$Q$2, 0)
Projected ach. %     M6 = IFERROR(L6/G6, 0)
MAX(…, 0) keeps the balance at zero once a salesperson crosses the target, so the required run rate does not turn negative. In the template, conditional formatting colours the projected achievement red below 100% and green at 100% or more, and marks negative growth in red. The eye goes straight to the people who need attention.
Worked example with real numbers
The template’s sample data (all fictional) covers September and October 2026 for six salespeople in three regions, with no sales on Sundays. The report date is Wednesday 21 October 2026. October has 31 days and 4 Sundays, so there are 27 selling days: 18 have gone and 9 are left.
Take Amit Sharma, whose monthly target is ₹18,00,000:
| Measure | Calculation | Result |
|---|---|---|
| FTD (21 Oct) | Sales on 21 October | ₹42,500 |
| MTD | 1 to 21 October | ₹11,62,000 |
| LMTD | 1 to 21 September | ₹11,04,000 |
| Growth % | 11,62,000 ÷ 11,04,000 − 1 | 5.3% |
| Achievement % | 11,62,000 ÷ 18,00,000 | 64.6% |
| Balance to target | 18,00,000 − 11,62,000 | ₹6,38,000 |
| Current run rate | 11,62,000 ÷ 18 | ₹64,556 per day |
| Required run rate | 6,38,000 ÷ 9 | ₹70,889 per day |
| Projected month-end | 11,62,000 ÷ 18 × 27 | ₹17,43,000 (96.8%) |
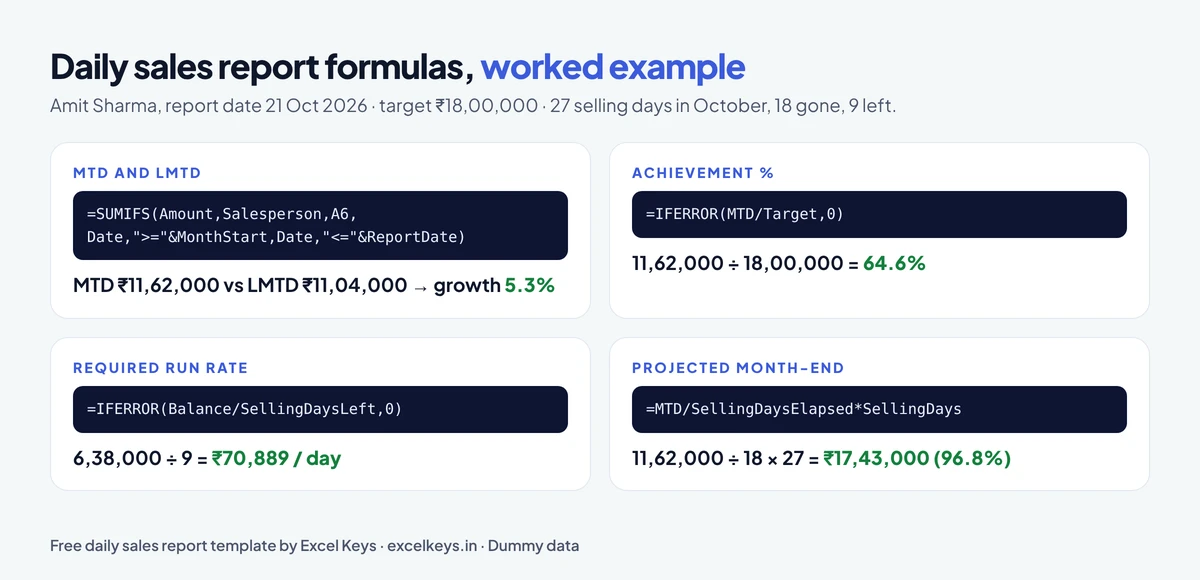
Amit is growing, but at today’s pace he lands at 96.8% of target. He needs about ₹6,300 more per selling day (₹70,889 against ₹64,556) to close the gap. That is a specific, reachable ask for a sales review, which a plain MTD number never gives you.
For the whole team, the report reads:
- MTD ₹59,72,000 against LMTD ₹56,14,500, a growth of 6.4%.
- Achievement 60.9% of the ₹98,00,000 target, with ₹38,28,000 still to go.
- Current run rate ₹3,31,778 per day; required run rate ₹4,25,333 per day; projected month-end ₹89,58,000, or 91.4% of target.
- Only Karthik Iyer is projected above target (103.0%). Ravi Patil is the main concern: sales are 3.9% below last month and he would need ₹89,833 a day against his current ₹49,528.
- By region, South grows 14.9% while West is 1.5% below last month. Product A brings 40.0% of MTD sales.
Why the selling-day basis matters. Switch C3 to Calendar days and the same data projects ₹88,15,810 (90.0%) instead of ₹89,58,000 (91.4%), because Sundays with no sales are counted as slow days. A gap of more than ₹1.4 lakh in the forecast comes only from choosing the wrong day count, so set the basis to match how your team actually sells.
Free daily sales report template (download)
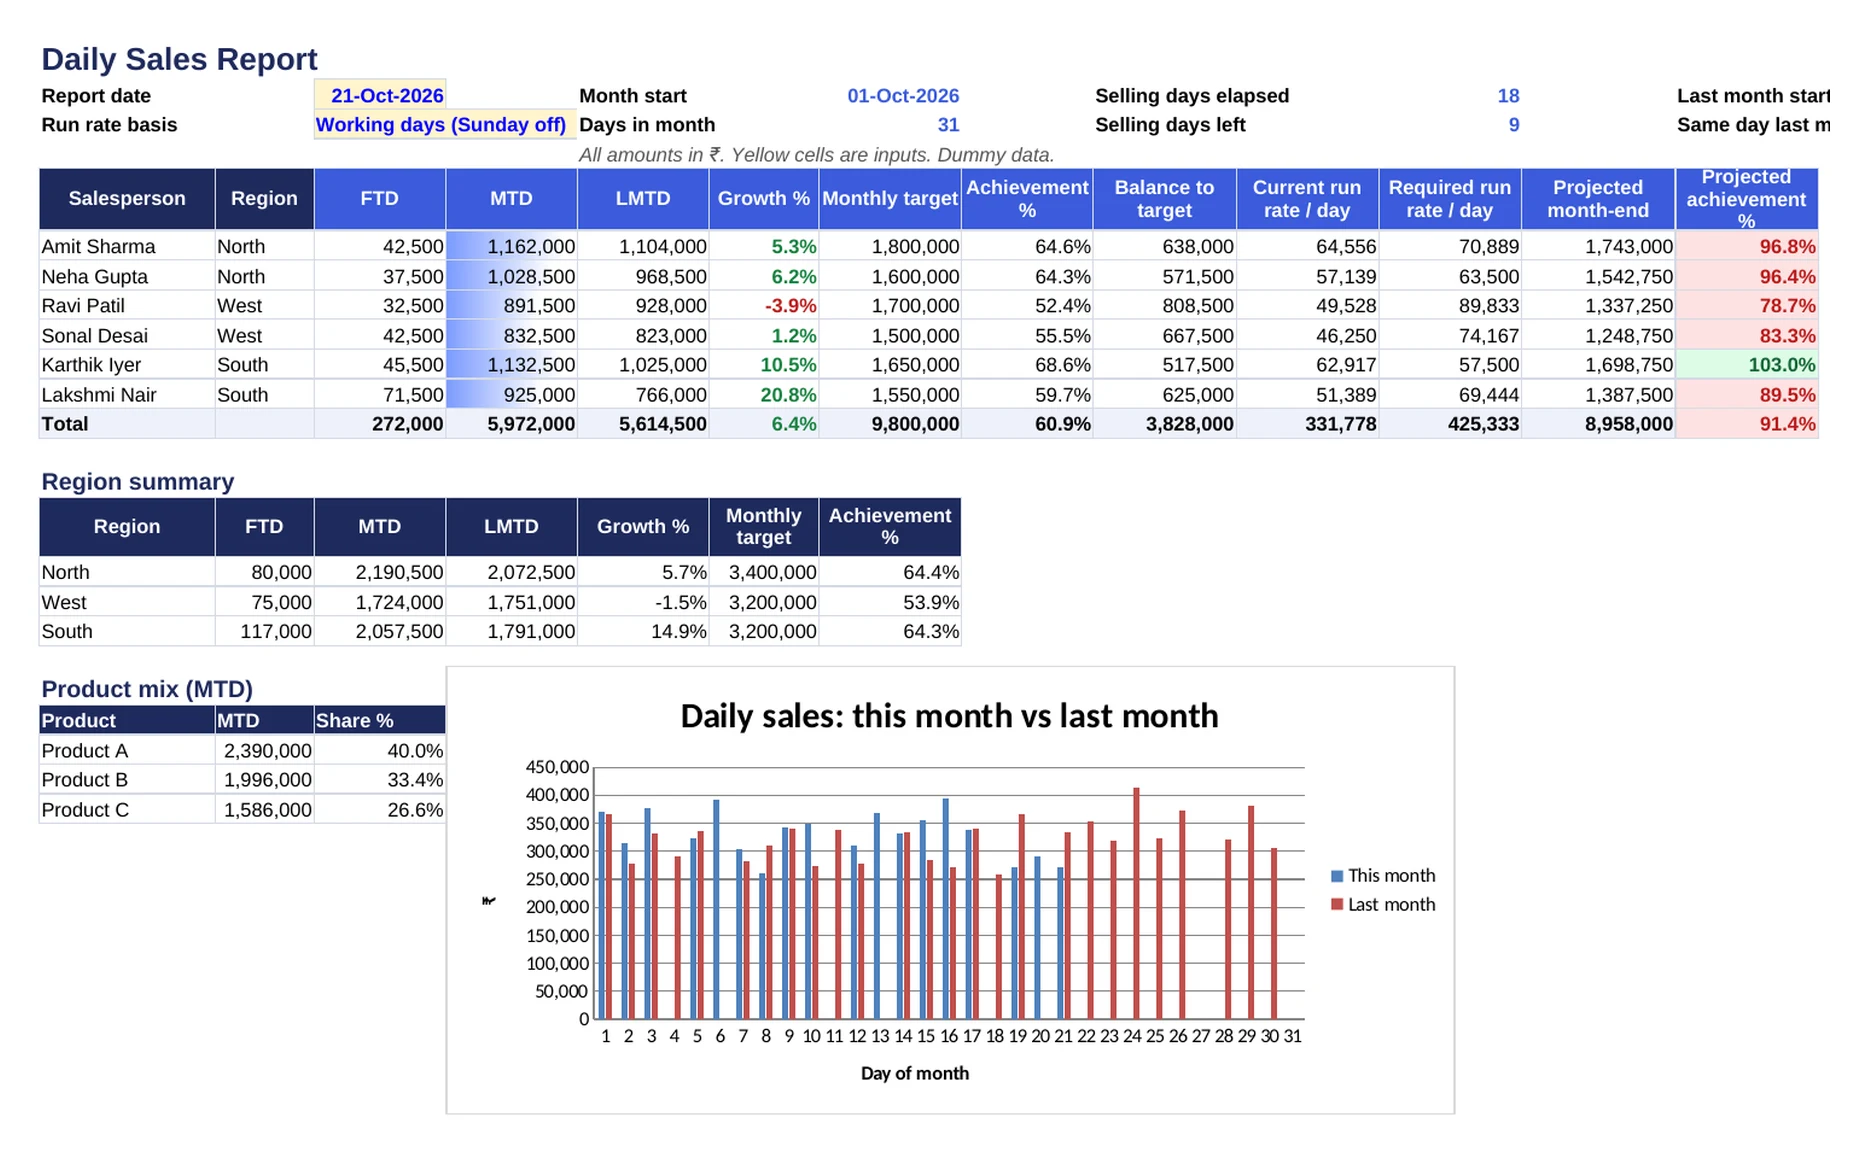
The workbook has four sheets:
- How to use: five steps and every definition in plain words.
- Daily Report: report date and run-rate inputs, the 13-column salesperson table with a total row, region summary, product mix and a daily trend chart comparing this month with last month.
- Data: 264 sample rows for September and October 2026. Formulas read up to row 5,000.
- Targets: salesperson, region and monthly target.
It uses SUMIFS, SUMIF, INDEX, MATCH, EOMONTH, EDATE and NETWORKDAYS.INTL, with no macros and no pivot tables to refresh, so it works in Excel 2010 and later and in Excel for the web.
To use it: replace the rows on the Data sheet with your own export, update the Targets sheet, and type today’s report date in C2. More free workbooks, including the attendance sheet and the TAT report, are on our free Excel templates page.
Common mistakes in daily sales reports
- Typing totals instead of formulas. One missed row and the whole report is wrong, with no way to trace why.
- Comparing MTD with the full last month. Use LMTD up to the same day, or growth looks negative for most of the month.
- Dates stored as text. SUMIFS with “>=” ignores text dates. Check that the Date column is right-aligned and formatted as a date.
- Calendar days for a six-day sales week. The projection comes out too low and the required run rate too soft.
- A new file every day. Keep one workbook, add rows to the Data sheet and change only the report date. The history then stays available for LMTD and trends.
When a daily sales report should become a dashboard
The template is enough for one team and one target. When the same report has to be cut by branch, product, channel and month for several managers, clicking filters is faster than maintaining extra tables. Our business performance dashboard and RM productivity dashboard show what that looks like, with live demos on sample data. If you are deciding between tools, read Excel dashboard or Power BI first.
Frequently asked questions
What should a daily sales report include?
One row per salesperson (or branch) with FTD, MTD, LMTD, growth %, monthly target, achievement %, balance to target, current and required run rate, and projected month-end. Add a total row, a region or product summary and a daily trend chart so readers can see why the totals moved.
What is FTD, MTD and LMTD in a sales report?
FTD means for the day, the sales on the report date. MTD means month to date, the sales from the 1st of the month to the report date. LMTD means last month to date, the sales from the 1st of last month to the same day last month. MTD ÷ LMTD − 1 gives the growth %.
How do I calculate MTD sales in Excel?
Use SUMIFS with two date conditions: =SUMIFS(Amount, Salesperson, A6, Date, “>=”&MonthStart, Date, “<=”&ReportDate). Get the month start with =EOMONTH(ReportDate,-1)+1. Change the report date and the MTD updates automatically.
What is the required run rate formula?
Required run rate = balance to target ÷ selling days left. In Excel: =IFERROR(MAX(Target-MTD,0)/DaysLeft,0). For example, a balance of ₹6,38,000 with 9 selling days left needs ₹70,889 per day.
How do I project month-end sales in Excel?
Divide MTD by the selling days gone and multiply by the selling days in the month: =MTD/DaysElapsed*DaysInMonth. Use NETWORKDAYS.INTL to count only working days if your team does not sell on Sundays, otherwise the projection is too low.
Can I use this daily sales report template in Google Sheets?
Yes. Upload the .xlsx file to Google Drive and open it with Google Sheets. SUMIFS, EOMONTH, EDATE, INDEX, MATCH and NETWORKDAYS.INTL all work there. Check the chart once after opening, as chart styles can look slightly different.
One date cell, one clear report every morning
A daily sales report earns its place when it tells the team what to do today, not just what happened yesterday. Download the template, paste your data and change the date each morning. If you want the same report as an interactive dashboard built around your own columns and targets, send us your requirement.